
Highlights
- RAK’s revenue rose 30.2% YoY to NZD 54.24 million in H1 FY2026, supported by contributions across key markets.
- Gross profit for H1 FY2026 increased 68% to NZD 26.46 million due to higher volumes and product mix changes.
- The company reaffirmed FY2026 underlying EBITDA guidance between NZD 15 million and NZD 24 million.
Rakon Limited (NZX:RAK) is a global technology company, engaged in the designing and manufacturing of advanced frequency control and timing solutions for a range of applications.
For the first half of the financial year (H1 FY26), RAK’s revenue increased to NZD 54.24 million from NZD 41.66 million in H1 FY25, representing a 30.2% YoY rise, with contributions from the company’s major markets. While gross profit grew to NZD 26.46 million in H1 FY26 from NZD 15.74 million H1 FY25, reflecting a 68% YoY increase, supported by higher volumes, changes in product mix, and early effects of global manufacturing optimisation.
Key Positives and Negatives
The company reported an increase in total current assets to NZD 125.5 million as of September 2025 from NZD 116.4 million as of September 2024. At the same time, the company reported higher cost of sales of NZD 27.7 million in H1 FY2026 versus NZD 25.9 million in the previous period and a loss after income tax benefit of NZD 2.9 million during H1 FY2026.
Business Outlook
RAK reaffirmed its FY2026 underlying EBITDA guidance in the range of NZD 15 million to NZD 24 million. Earnings are expected to be weighted toward H2 FY2026, reflecting historical seasonality and the timing of major program deliveries.
Share Performance of RAK
The stock closed 3.66% lower at NZD 0.79 per share on 05 December 2025, with an intraday loss of 3.66%. Over the past week, it declined by 11.26%, while over one month, the stock gained 6.76%, and over three months, it fell by 9.20%. The one-year return stood at 31.76%. The 52-week high was NZD 0.9200 on 29 July 2025, and the 52-week low was NZD 0.4100 on 24 April 2025.
Support and Resistance Summary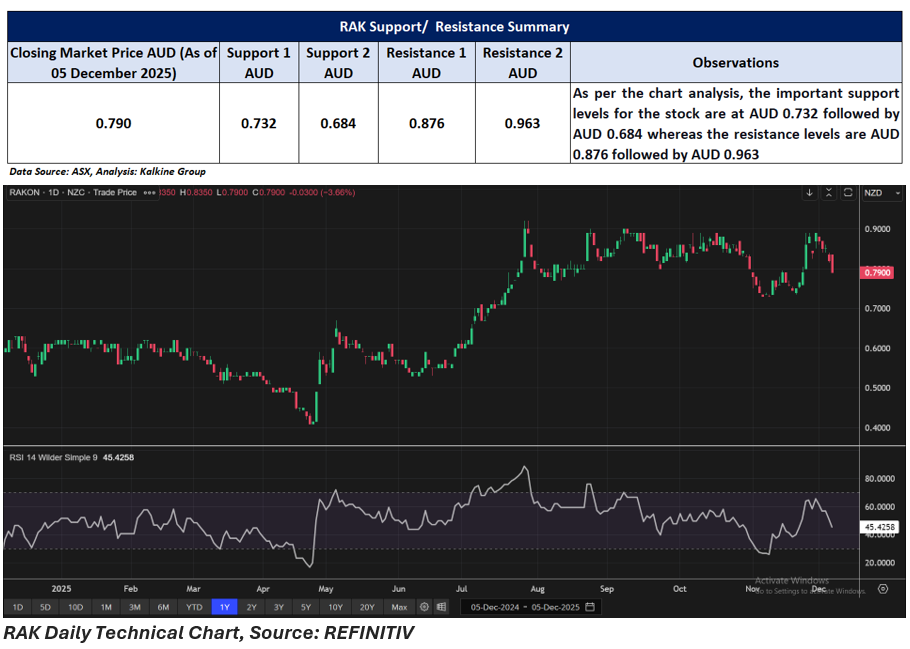
Note 1: Past performance is neither an Indicator nor a guarantee of future performance.
Note 2: The reference date for all price data, and currency, is 05 December 2025. The reference data in this report has been partly sourced from EODHD/Others.
Technical Indicators Defined:
Support: A level at which the stock prices tend to find support if they are falling, and a downtrend may take a pause backed by demand or buying interest. Support 1 refers to the nearby support level for the stock and if the price breaches the level, then Support 2 may act as the crucial support level for the stock.
Resistance: A level at which the stock prices tend to find resistance when they are rising, and an uptrend may take a pause due to profit booking or selling interest. Resistance 1 refers to the nearby resistance level for the stock and if the price surpasses the level, then Resistance 2 may act as the crucial resistance level for the stock.


_12_18_2025_13_13_17_985559.png)
_11_27_2025_13_17_04_571639.png)
 Please wait processing your request...