
Highlights
- Total income of TWL increased 24.03% year-on-year to NZD 4.60 million in H1 FY26.
- Total current assets rose 36.38% IN H1 FY26, supported by higher cash and cash equivalents.
- Trading revenue growth was recorded across all core product lines.
Trade Window Holdings Limited (NZX:TWL), a New Zealand–based early-stage software company, reported improved financial performance for the first half of the financial year 2026 (H1 FY26). Total income for H1 FY26 rose to NZD 4.60 million, representing a 24.03% increase compared with NZD 3.71 million in H1 FY25. The growth was driven by higher trading revenue, supported by consistent sales momentum across all of the company’s core software products.
Balance Sheet Position
The company’s balance sheet also strengthened during the period. Total current assets as of 30 September increased to NZD 1.98 million, up 36.38% year-on-year from NZD 1.45 million. The increase was largely attributable to higher cash and cash equivalents. Trade Window ended the half year with cash and cash equivalents of approximately NZD 1.1 million.
Management Shareholding Update
In a business update released on 13 January 2026, the company disclosed a change in the shareholding of its Director and Chief Executive Officer, Albertus Johannes Smith. His holding stood at 6,840,965 ordinary shares, compared with 6,888,694 shares previously reported.
Operating Challenges Remain
The company reported a negative return on equity of 16.7% in H1 FY26 and a negative operating margin of 28% for the period. In addition, the cash cycle shortened to 40.9 days from 48.7 days in the prior corresponding period.
Outlook Anchored in Structural Demand Drivers
Looking ahead, the company stated that it remains focused on growth and scalability rather than short-term profitability. The company expects long-term structural drivers—including increasing complexity in trade regulations, continued growth in e-commerce, and ongoing supply-chain disruptions—to support sustained demand for its software solutions.
Share Performance of TWL
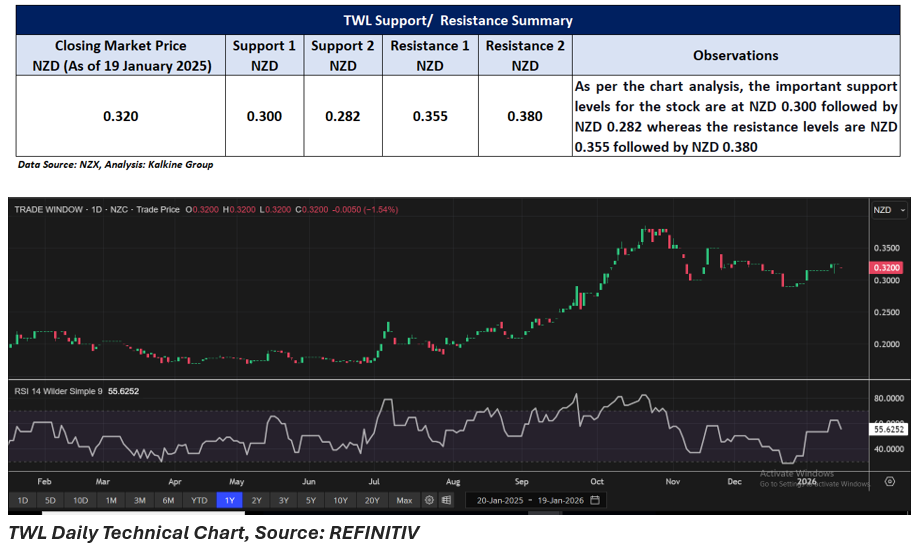
TWL shares closed at NZD 0.32 per share on 19 January 2026. Over a year, TWL’s share price has increased by approximately 64.95% and in nine months, it has jumped 79.78%. In a month, the share price has rallied 10.34% and in three months, it has dropped 15.79%.
Support and Resistance Summary
Note 1: Past performance is neither an Indicator nor a guarantee of future performance.
Note 2: The reference date for all price data, and currency, is 19 January 2026. The reference data in this report has been partly sourced from EODHD/Others.
Technical Indicators Defined:
Support: A level at which the stock prices tend to find support if they are falling, and a downtrend may take a pause backed by demand or buying interest. Support 1 refers to the nearby support level for the stock and if the price breaches the level, then Support 2 may act as the crucial support level for the stock.
Resistance: A level at which the stock prices tend to find resistance when they are rising, and an uptrend may take a pause due to profit booking or selling interest. Resistance 1 refers to the nearby resistance level for the stock and if the price surpasses the level, then Resistance 2 may act as the crucial resistance level for the stock.


_12_18_2025_13_13_17_985559.png)

_11_27_2025_13_17_04_571639.png)
 Please wait processing your request...