_11_27_2025_13_17_04_571639.png)
Highlights
- Investore Property reported net rental income of NZD 31,609k in H1 FY 2026.
- Profit after tax attributable to shareholders increased to NZD 12,785k in H1 FY 2026.
- Gross margin reached 81.3% while debt-to-equity ratio stood at 0.70x in H1 FY 2026.
Investore Property Limited (NZX:IPL) is a New Zealand–based company focused on owning and managing income-producing property assets.
For the first half of financial year 2026 (H1 FY26), the company reported net rental income of NZD 31,609k, compared to NZD 31,191k in H1 FY 2025, representing an increase of 1.3% YoY. Profit after income tax attributable to shareholders rose to NZD 12,785k in H1 FY26 from NZD 9,662k in the prior corresponding period, reflecting a 32.3% YoY increase, primarily due to a lower net reduction in the fair value of investment properties.
During the reported period, the company delivered resilient operating earnings and returns to shareholder, while executing its strategic objectives of portfolio optimisation and targeted acquisition.
Key Positives and Negatives
In H1 FY26, the company reported a gross margin of 81.3%, higher than the industry median of 71.6%, and an EBITDA margin of 71.4%, above the industry median of 64.2%. However, the company’s net margin stood at 32.9%, below the industry median of 56.1%, and its debt-to-equity ratio reached 0.70x, exceeding the industry median of 0.36x.
Business Outlook
The company’s board has reaffirmed the full-year FY 2026 cash dividend guidance at 6.50 cents per share.
Share Performance of IPL
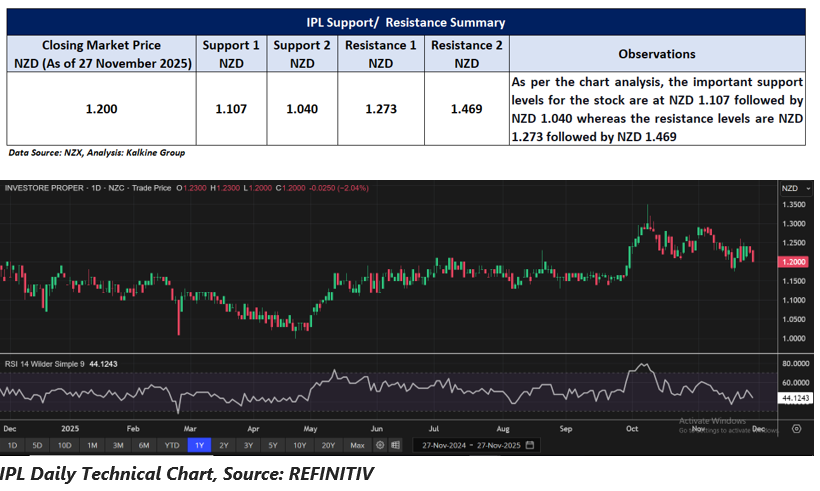
IPL’s shares were trading at NZD 1.20 per share on 27 November 2025, with an intraday loss of 2.04%. IPL’s stock has increased by 3.45% in the last three months, 7.14% over the six months and increased by 1.69% over the past year. IPL’s 52-week high is NZD 1.35, recorded on 08 October 2025, and the 52-week low is NZD 1.00, recorded on 23 April 2025.
Support and Resistance Summary
Note 1: Past performance is neither an Indicator nor a guarantee of future performance.
Note 2: The reference date for all price data, and currency, is 27 November 2025. The reference data in this report has been partly sourced from EODHD/Others.
Technical Indicators Defined:
Support: A level at which the stock prices tend to find support if they are falling, and a downtrend may take a pause backed by demand or buying interest. Support 1 refers to the nearby support level for the stock and if the price breaches the level, then Support 2 may act as the crucial support level for the stock.
Resistance: A level at which the stock prices tend to find resistance when they are rising, and an uptrend may take a pause due to profit booking or selling interest. Resistance 1 refers to the nearby resistance level for the stock and if the price surpasses the level, then Resistance 2 may act as the crucial resistance level for the stock.


_12_18_2025_13_13_17_985559.png)


 Please wait processing your request...