Please take a few seconds to register for free and gain access to...
7-Days Free Trial, no credit card required
![]() Trusted by 20K+ Investors
Trusted by 20K+ Investors

Scan to Download
Download the app and activate your free trial
Get a macro view on listed stocks segmented by sector, or market capitalization.
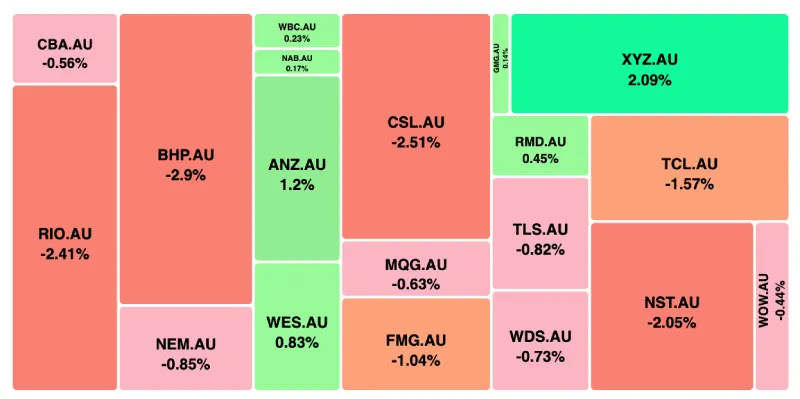
Note: Top 20 stocks by Market Cap (Daily % price change)
Note: Daily price change (%) by sector excluding stocks with ±90% daily price change. Companies above $500 million market capitalization are considered.
Data Powered by EODHD
14.90%
Small-Cap
Entry Price :
198.21%
Small-Cap
Entry Price :
53.94%
Dividend Income Report
Entry Price :
59.88%
Mid - Cap
Entry Price :
43.57%
US Dividend Income Report
Entry Price :
109.35%
Healthcare Report
Entry Price :
33.74%
Small-Cap
Entry Price :
1.74%
American Tech Report
Entry Price :
81.44%
GROkal® (Kalkine Growth Report)
Entry Price :
63.82%
Global Green Energy Report
Entry Price :
11.24%
Bullish Chart Report
Entry Price :
14.69%
AU Technical Analysis Report
Entry Price :
3.95%
Small-Cap
Entry Price :
9.84%
Bullish Chart Report
Entry Price :
56.32%
Small-Cap
Entry Price :
 Please wait processing your request...