
Highlights
- KMD Brands reported FY 2025 sales of NZD 989,015K, up 1% year-on-year.
- The company recorded a gross margin of 58.5% and current ratio of 1.58x in H1 FY 2025.
- KMD plans 14 store closures and six new openings as part of FY 2026 strategy.
KMD Brans Limited (NZX:KMD) is a global company specialising in outdoor, lifestyle, and sports products. The firm designs, markets, retails, and wholesales apparel, footwear, and equipment focused on surfing and outdoor activities.
Financial Update
For the financial year 2025 (FY25), KMD recorded sales of NZD 989,015k, up 1.0% from NZD 9,600k FY24. Sales in Q3 were affected by unusually warm weather but improved in Q4 due to enhanced promotional efforts in FY25. EBITDA fell to NZD 50,546k in FY25 from NZD 107,235k the previous year. The company reported a net loss of NZD 93,579k in FY25, compared with NZD 48,323k in FY24, partly due to a NZD 45.4 million write-down of Oboz’s intangible assets, while operating expenses remained controlled despite global cost pressures.
Key Positives and negatives
In the first half of FY25, KMD reported a gross margin of 58.5%, above the industry median of 37.8%, and a current ratio of 1.58x, higher than the industry median of 1.28x, cost efficiency and liquidity. However in the same period company recorded a negative net margin of -4.4% and an operating margin of -2.7%.
Business Outlook
KMD indicated that despite ongoing global uncertainty, wholesale sales are showing signs of improvement, supported by forward orders and in-season purchases from key accounts. The company is focusing on managing net working capital and aims to keep net debt below NZD 40 million by 31 July 2026. Following the announcement of 21 planned store closures, KMD expects to close 14 stores in FY 2026 while opening six new locations, including three Kathmandu flagship stores in H1 FY 2026, in line with its integrated marketplace and store segmentation strategy.
Share Performance of KMD
KMD’s shares were trading at NZD 0.2800 per share on 10 November 2025. KMD’s stock is up 11.74% in last three months, 18.57% down over the six months, and decline 35.22% over the past year. KMD’s 52-week high is NZD 0.4450, recorded on 08 January 2025 and 52-week low is NZD 0.2300, recorded on 23 September 2025.
Support and Resistance Summary
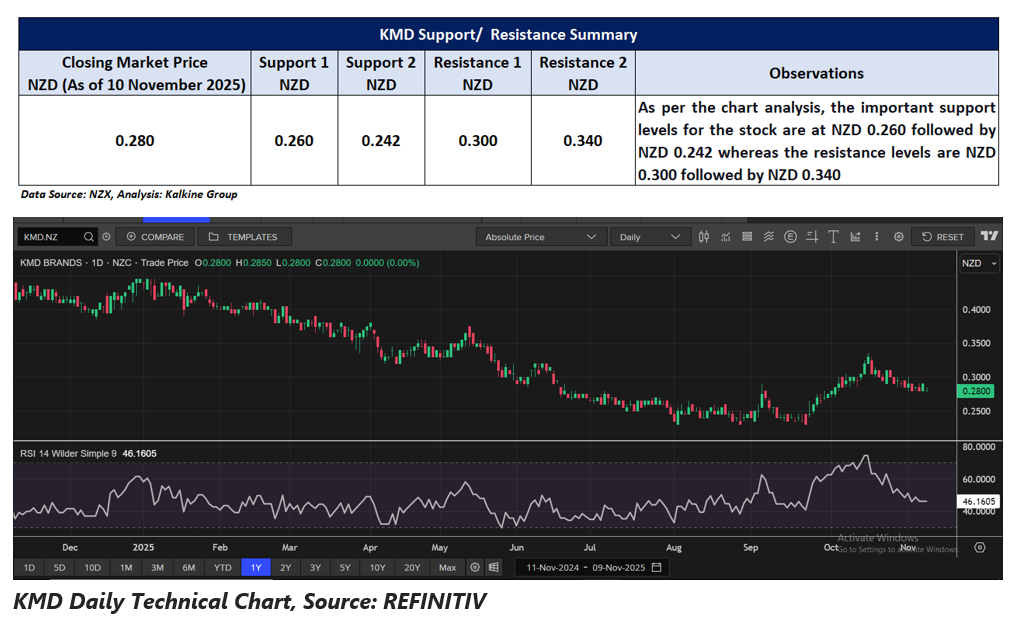
KMD Daily Technical Chart, Source: EODHD/Others
Note 1: Past performance is neither an Indicator nor a guarantee of future performance.
Note 2: The reference date for all price data, and currency, is 10 November 2025. The reference data in this report has been partly sourced from EODHD/Others.
Technical Indicators Defined:
Support: A level at which the stock prices tend to find support if they are falling, and a downtrend may take a pause backed by demand or buying interest. Support 1 refers to the nearby support level for the stock and if the price breaches the level, then Support 2 may act as the crucial support level for the stock.
Resistance: A level at which the stock prices tend to find resistance when they are rising, and an uptrend may take a pause due to profit booking or selling interest. Resistance 1 refers to the nearby resistance level for the stock and if the price surpasses the level, then Resistance 2 may act as the crucial resistance level for the stock.


_12_18_2025_13_13_17_985559.png)

 Please wait processing your request...