
Image source: Shutterstock
Highlights
- The YieldMax™ Universe Fund of Option Income ETFs (YMAX) seeks to generate current income.
- The fund primarily allocates its assets into shares of other ETFs, rather than directly investing in individual company securities.
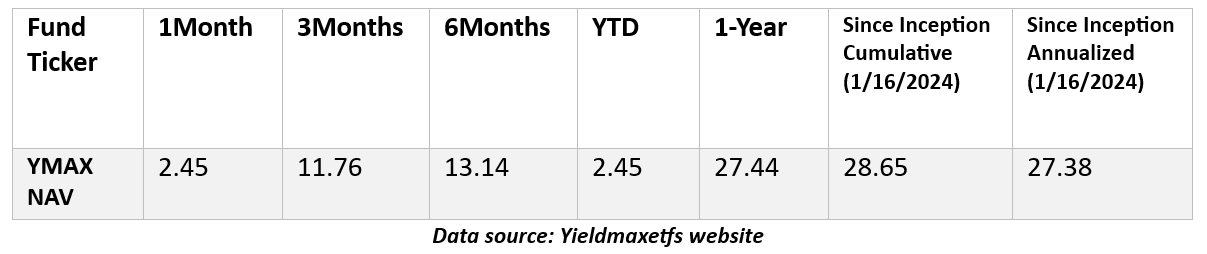
- The ETF has provided a return of around 13% in the past six months and around 27% in the past year.
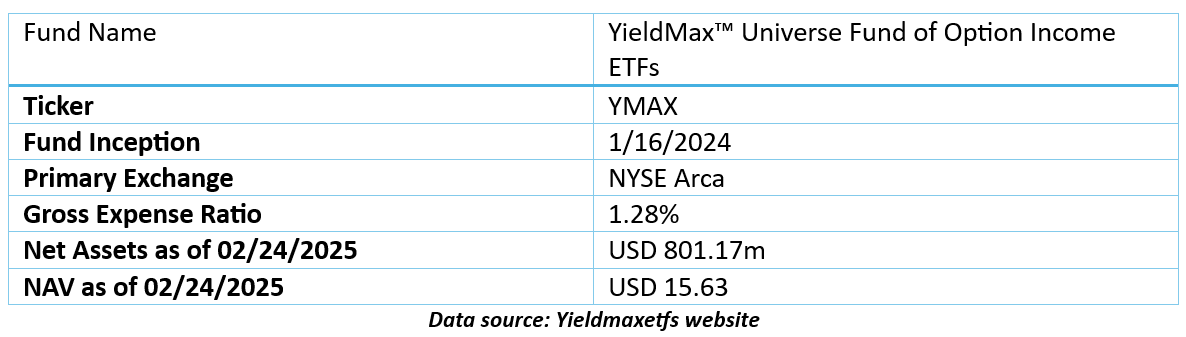
The YieldMax™ Universe Fund of Option Income ETFs (YMAX) is an actively managed exchange-traded fund designed to generate current income. As a "fund of funds," it primarily allocates its assets into shares of other ETFs, rather than directly investing in individual company securities. Additionally, the fund may occasionally invest directly in the securities and financial instruments held by one or more of the underlying YieldMax™ ETFs.
The fund’s portfolio is primarily composed of “YieldMax™ ETFs,” (each, an “Underlying YieldMax™ ETF”). Due to the investment strategies of the Underlying YieldMax™ ETFs, the fund’s indirect exposure to gains, if any, of the share price returns of the underlying securities is capped.
Fund Information (As of January 31, 2025)
The fund has its largest holding in YieldMax BABA Option Income Strategy ETF followed by YieldMax DIS Option Income Strategy ETF at 3.76% and 3.65%, respectively.
As of January 31, 2025, the fund’s NAV performance (%) is as follows:
YMAX Technical Summary and Chart
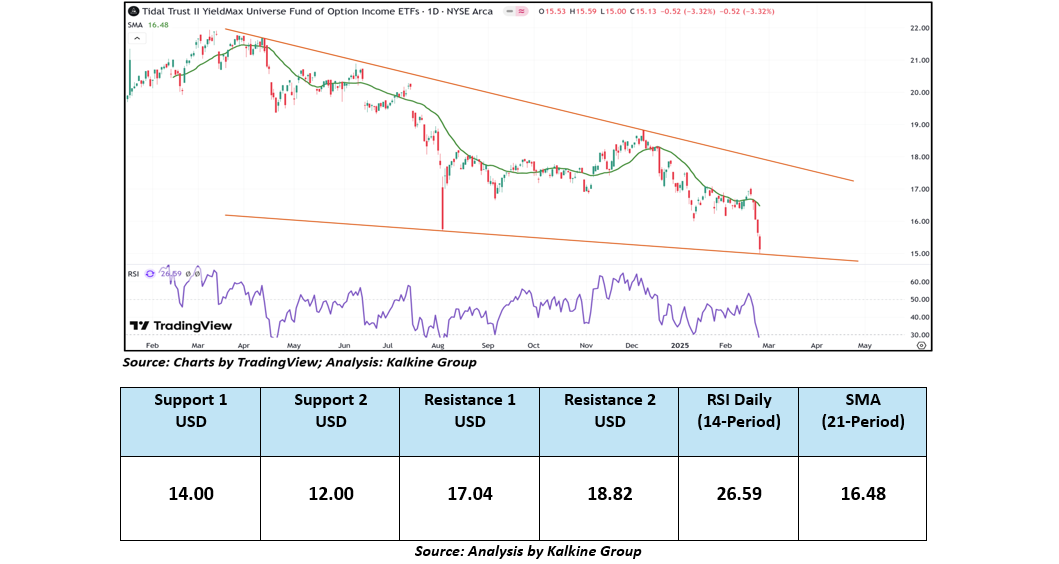
While undergoing a downtrend, YMAX's ETF prices are forming a descending wedge pattern, suggesting weakening downward momentum. Furthermore, the 14-period Relative Strength Index (RSI) is in the oversold zone, signaling a potential reversal. Prices are trading between the pattern’s upper and lower boundaries, which might serve as dynamic resistance and support levels for the ETF, respectively. A significant support level for the ETF is positioned at USD 14.00, while critical resistance level is situated at USD 17.04.
The YieldMax™ Universe Fund of Option Income ETFs (YMAX) seeks current income through exposure to other ETFs. Its strategy of allocating assets in YieldMax™ ETFs offers diversified exposure, though, with a cap on potential gains.
However, it's important to remember that past performance is not a reliable indicator of future results. When selecting an ETF, it's essential to consider individual sector preferences, risk tolerance, and the specific performance of the underlying index.
Technical Indicators Defined: -
Support: A level at which the stock prices tend to find support if they are falling, and a downtrend may take a pause backed by demand or buying interest. Support 1 refers to the nearby support level for the stock and if the price breaches the level, then Support 2 may act as the crucial support level for the stock.
Resistance: A level at which the stock prices tend to find resistance when they are rising, and an uptrend may take a pause due to profit booking or selling interest. Resistance 1 refers to the nearby resistance level for the stock and if the price surpasses the level, then Resistance 2 may act as the crucial resistance level for the stock.
Abbreviations
CMP: Current Market Price
SMA: Simple Moving Average
AUD: Australian Dollar
RSI: Relative Strength Index


_12_18_2025_13_13_17_985559.png)

 Please wait processing your request...