
Image source: © 2025 Krish Capital Pty.Ltd
Highlights
- SMCY uses call options on Super Micro Computer, Inc. (NASDAQ: SMCI) to generate monthly distributions without holding the stock directly.
- The fund delivered a 3-month NAV return of +29.81% as of June 30, 2025.
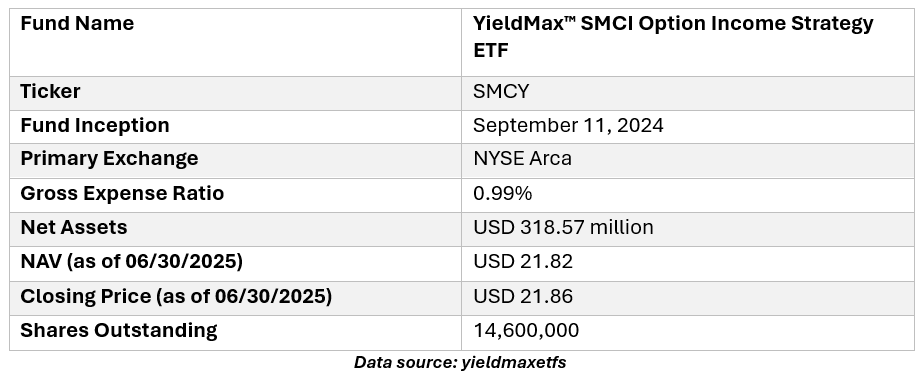
- SMCY’s net assets stood at USD 318.57 million, with 14.6 million shares outstanding as of June 30, 2025
The YieldMax™ SMCI Option Income Strategy ETF (NYSEARCA: SMCY) is an actively managed exchange-traded fund that aims to deliver monthly distributions by utilizing a call-writing strategy on Super Micro Computer, Inc. (SMCI). It provides indirect exposure to SMCI’s share price movements while limiting upside potential and absorbing full downside risk.
Investment Objectives:
- Primary: Seek current income through options premiums.
- Secondary: Provide exposure to the price performance of SMCI, subject to a cap on gains.
Performance
As of June 30, 2025, the YieldMax™ SMCI Option Income Strategy ETF (SMCY) delivered a 3-month return of +29.81% (NAV) and +30.52% (market price). The fund also posted a 1-month return of +18.57% (NAV). Despite recent gains, SMCY remains down -11.85% (NAV) and -13.08% (market) on a cumulative basis since its inception on September 11, 2024.
Key Risk Information
• The ETF does not directly invest in SMCI stock; instead, it uses derivatives to simulate exposure.
• Its options-based strategy limits upside potential if SMCI shares rally strongly.
• The Fund is subject to full downside risk if SMCI declines, which may not be offset by monthly income.
Technical Snapshot
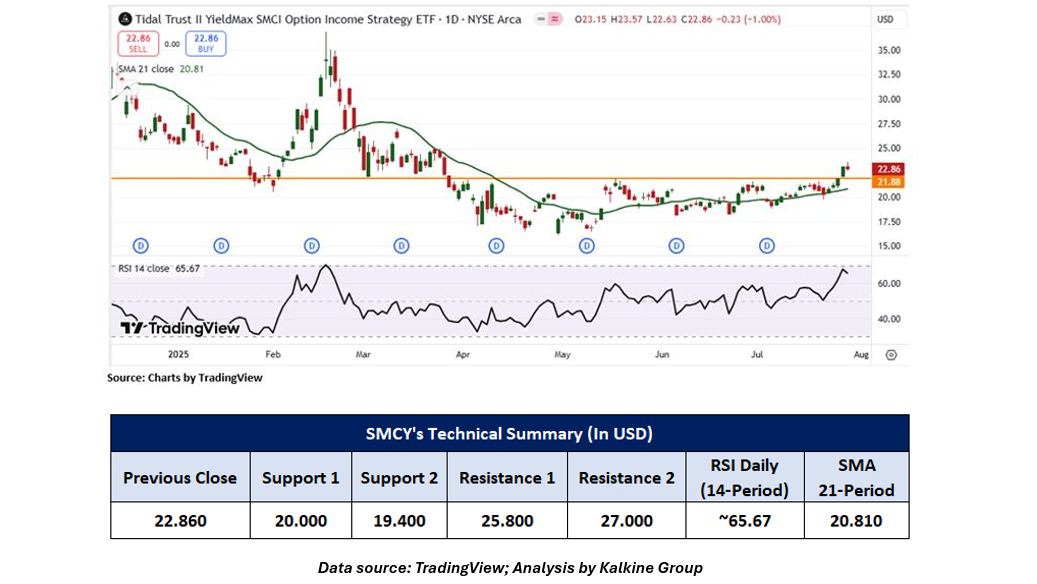
The ETF’s price action remains comfortably above a key horizontal trendline support level, which has been tested multiple times in the recent past. This level now serves as a strong price floor, reinforcing bullish sentiment as buyers continue to step in at or above this zone. A sustained hold above this support signals accumulation interest and validates the underlying trend strength. The Relative Strength Index (RSI), a key momentum oscillator, is currently reading around 65.67, which suggests the ETF is in bullish territory but not yet overbought (the overbought threshold being 70). This level indicates that momentum is positive and gaining strength, without showing signs of exhaustion. It reflects increasing demand and healthy upside potential, while still leaving room for further price appreciation. The ETF is also trading above its 21-period SMA, a short-term trend-following indicator that acts as dynamic support in trending markets. The upward slope of this moving average further strengthens the case for a bullish trend continuation. Historically, prices maintaining above the 21-SMA often suggest short-term buying opportunities on dips, as traders view this as a key tactical support level.
It's important to remember that past performance is not a reliable indicator of future results. When selecting an ETF, it's essential to consider individual sector preferences, risk tolerance, and the specific performance of the underlying index.
Technical Indicators Defined: -
Support: A level at which the ETF prices tend to find support if they are falling, and a downtrend may take a pause, backed by demand or buying interest. Support 1 refers to the nearby support level for the ETF, and if the price breaches the level, then Support 2 may act as the crucial support level for the ETF.
Resistance: A level at which the ETF prices tend to find resistance when they are rising, and an uptrend may pause due to profit booking or selling interest. Resistance 1 refers to the nearby resistance level for the ETF, and if the price surpasses the level, then Resistance 2 may act as the crucial resistance level for the ETF.
Abbreviations
CMP: Current Market Price
SMA: Simple Moving Average
RSI: Relative Strength Index
USD: United States Dollar


_12_18_2025_13_13_17_985559.png)

 Please wait processing your request...