
Image source: Shutterstock
Highlights
- The Smart US Large Value ETF (USV) focuses on large US value companies and has provided a one-year return of 10.83%
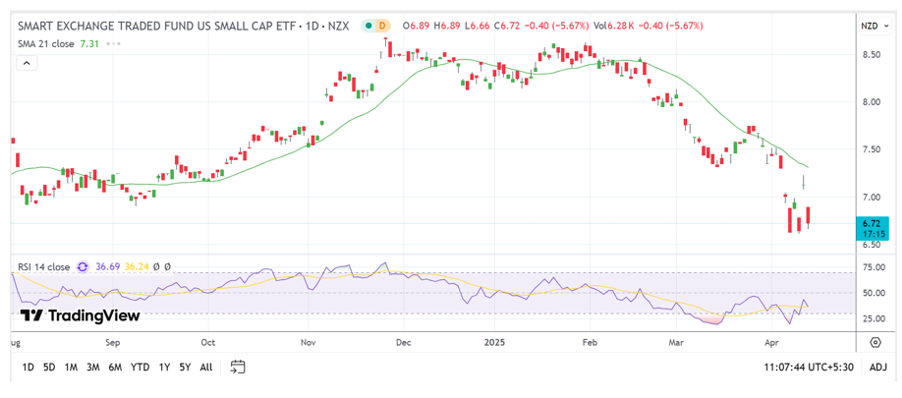
- The Smart US Small Cap ETF has delivered returns of 14.39% over five years
- Smart's Global Aggregate Bond ETF (AGG) provides low-cost exposure to global corporate bonds and has delivered a one-year return of 2.28%
Exchange Traded Funds (ETFs) are a convenient way to start building a balanced portfolio and it's no surprise that they are among the fastest-growing investment products worldwide.
Smart, rebranded from Smartshares in October 2024, is a popular investment fund manager in Aotearoa, New Zealand, and a wholly owned subsidiary of NZX Limited. Smart ETFs offer key benefits such as a wide range of options, easy access, and competitive fees. However, like most investments, ETFs come with some risks, and understanding these risks is crucial to determining whether they align with your financial and life goals.
Smart offers a diverse range of ETFs, including the Smart US Large Value ETF, Smart US Small Cap ETF, and Smart Global Aggregate Bond ETF, providing investors with unique exposure to US and global markets.
Smart US Large Value ETF (USV)
The Smart US Large Value ETF tracks the return of the CRSP US Large Cap Value Index, which contains large US value companies. The fund has 99.87% of its holdings in the Vanguard Value ETF.
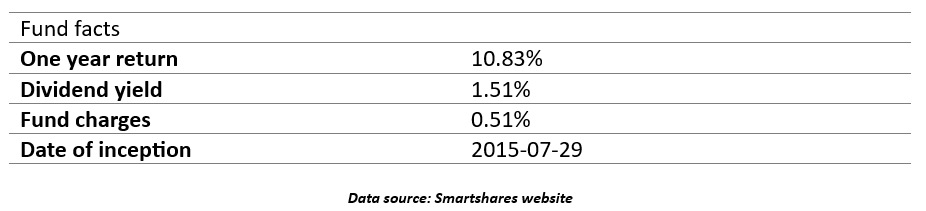
As of 10 April 2025, the fund has delivered returns of 12.52% and 15.36% to its investors over the past three and five years, respectively.
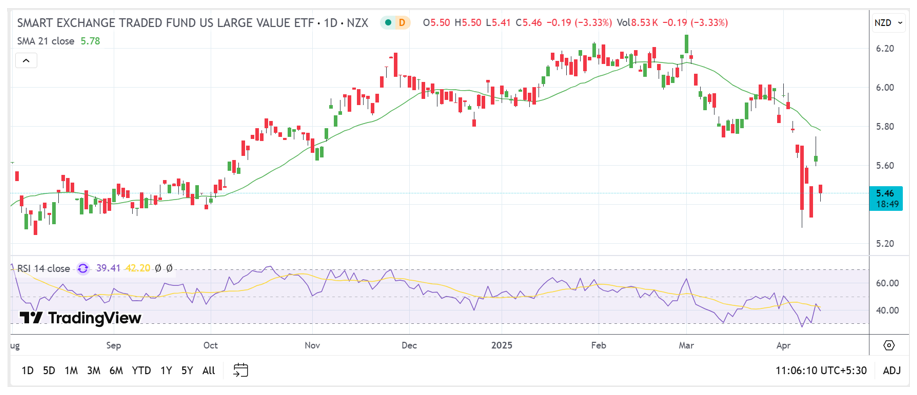
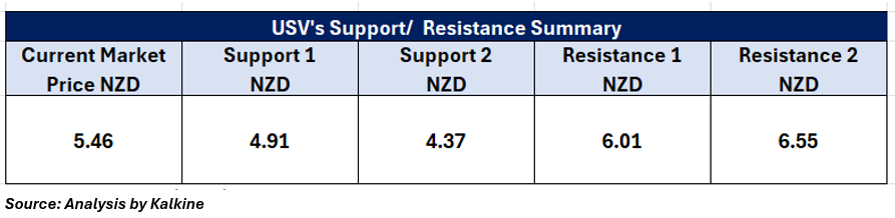
On the technical chart, the USV ETF is trading near a key support level, indicating potential short-term upward momentum. The 14-period Relative Strength Index (RSI) is below the midpoint, suggesting a possible rebound. Rising trading volumes further support a bullish outlook. However, prices remain below the 21-day Simple Moving Average (SMA), which acts as immediate resistance. A breakout above this level could lead to further gains. Key levels to watch are resistance at NZD 6.55 and strong support at NZD 4.37.
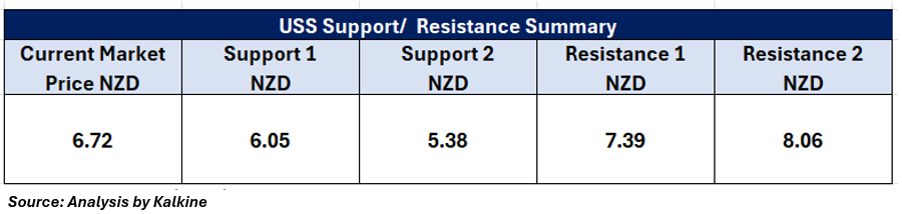
Smart US Small Cap ETF (USS)
The Smart US Small Cap ETF tracks the return of the CRSP US Small Cap Index, which contains small-sized US companies. The fund has 99.89% of its holdings in the Vanguard Small-Cap ETF.

As of 10 April 2025, the fund has delivered returns of 7.72% and 14.39% to its investors over the past three and five years, respectively.
The USS ETF is trading below a key support level, signalling short-term bearish momentum. However, it holds above upward sloping trendline support, which could indicate a potential reversal. The 14-period RSI remains below the midpoint, hinting at a possible rebound. Increasing trading volumes support a bullish shift, though the price is still below the 21-day SMA, acting as near-term resistance. Key levels to monitor are resistance to NZD 8.06 and support at NZD 5.38.
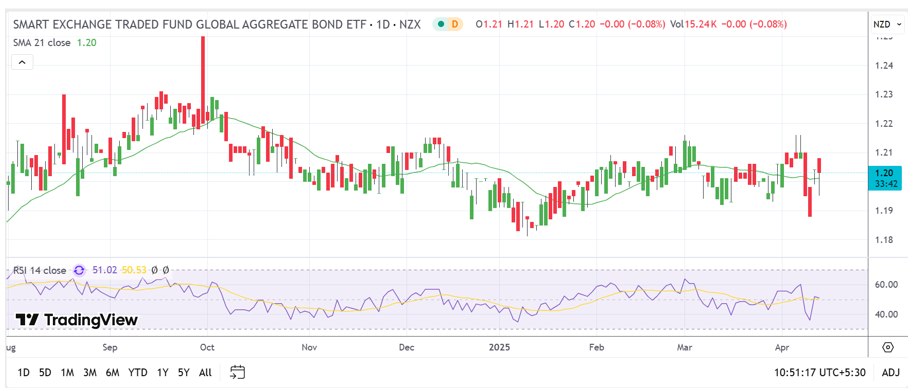
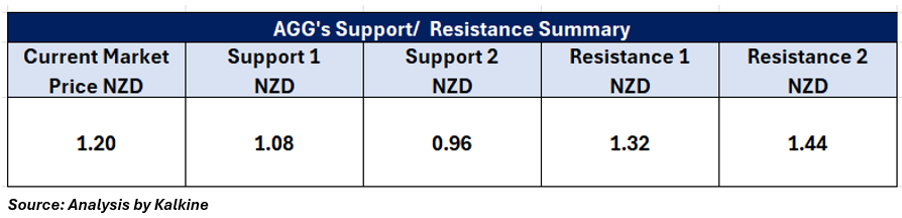
Smart Global Aggregate Bond ETF (AGG)
The Smart Global Aggregate Bond ETF tracks the return of the Bloomberg Global Aggregate Total Return Index Hedged NZD, which contains global corporate bonds. The fund has 99.96% of its holdings in the iShares Core Global Aggregate Bond UCITS ETF.
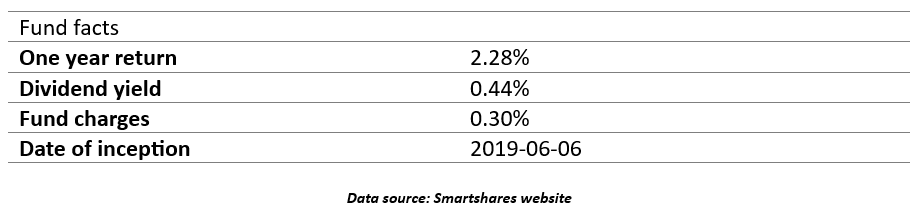
As of 10 April 2025, the fund has delivered returns of 0.42% and 2.28% to its investors over the past three months and one year, respectively.
The AGG ETF is exhibiting short-term bullish momentum, trading above a key support level and maintaining its position above an upward-sloping trendline—both indicators of a potential sustained uptrend. The 14-period RSI is above the midpoint, suggesting continued strength and room for further gains. Rising trading volumes also support the bullish outlook. Additionally, the price is holding above the 21-day Simple Moving Average (SMA), which now acts as immediate support. Key levels to monitor are resistance at NZD 1.44 and support at NZD 0.96.
However, it's important to remember that past performance is not a reliable indicator of future results. When selecting an ETF, it's essential to consider individual sector preferences, risk tolerance, and the specific performance of the underlying index.
Technical Indicators Defined: -
Support: A level at which the stock prices tend to find support if they are falling, and a downtrend may take a pause backed by demand or buying interest. Support 1 refers to the nearby support level for the stock and if the price breaches the level, then Support 2 may act as the crucial support level for the stock.
Resistance: A level at which the stock prices tend to find resistance when they are rising, and an uptrend may take a pause due to profit booking or selling interest. Resistance 1 refers to the nearby resistance level for the stock and if the price surpasses the level, then Resistance 2 may act as the crucial resistance level for the stock.
Abbreviations
CMP: Current Market Price
SMA: Simple Moving Average
AUD: Australian Dollar
RSI: Relative Strength Index


_12_18_2025_13_13_17_985559.png)

 Please wait processing your request...