
Image source: Shutterstock
Highlights
- THL reported a 33% YoY drop in underlying NPAT to NZD 26.5 million for 1HFY25.
- Statutory NPAT declined 36% YoY to NZD 25.3 million in 1HFY25, and underlying EBITDA fell 5% to NZD 113.3 million.
- THL declared a fully imputed interim dividend of 2.5 cents per share for FY25.
Tourism Holdings Limited (NZX:THL) is a tourism and a commercial recreational vehicle rental (RV) operator. THL reported a significant decline in profitability in the financial year 2025 (FY25). The company posted an underlying net profit after tax (NPAT) of NZD 26.5 million, down 33% YoY, while statutory NPAT dropped 36% YoY to NZD 25.3 million. Underlying EBITDA for the period stood at NZD 113.3 million, marking a 5% YoY decrease.
Despite the subdued earnings, the company benefited from the ongoing recovery in global tourism, which supported an 11% increase in its rental fleet and 8% growth in rental revenue.
Tariff Headwinds in Canada
THL acknowledges the impact of new Canadian tariffs. The Canadian government has announced a 25% tariff on the non-Canadian and non-Mexican content of CUSMA-compliant RVs imported from the U.S.—a development that directly affects THL, which sources 100% of its Canadian RV fleet from U.S. manufacturers.
The company estimates an effective tariff rate of around 22% on these vehicle imports. This is expected to increase the value of THL’s existing RV inventory in Canada, which was acquired prior to the tariff implementation, although the overall financial effect remains uncertain.
To mitigate these impacts, THL has:
- Accelerated delivery of about half its 2025 RV builds into Canada ahead of the tariff deadline.
- Relocated a portion of its U.S. fleet to Canada in preparation.
Recent business update
On 17 April 2025, the company highlighted that inbound tourism to the USA, with bookings from key European markets down 40–50% year-on-year. This decline is expected to persist through the high season starting in June.
Other markets, such as Canada, are experiencing modest rental growth, but limited fleet capacity caps potential upside. Encouragingly, rental bookings for FY26 outside the U.S. are showing positive trends, pointing to a potential rebound in the longer term.
Given current trading patterns, THL now expects underlying NPAT for FY25 to fall significantly below the NZD 45.2 million analyst consensus.
Share performance of THL
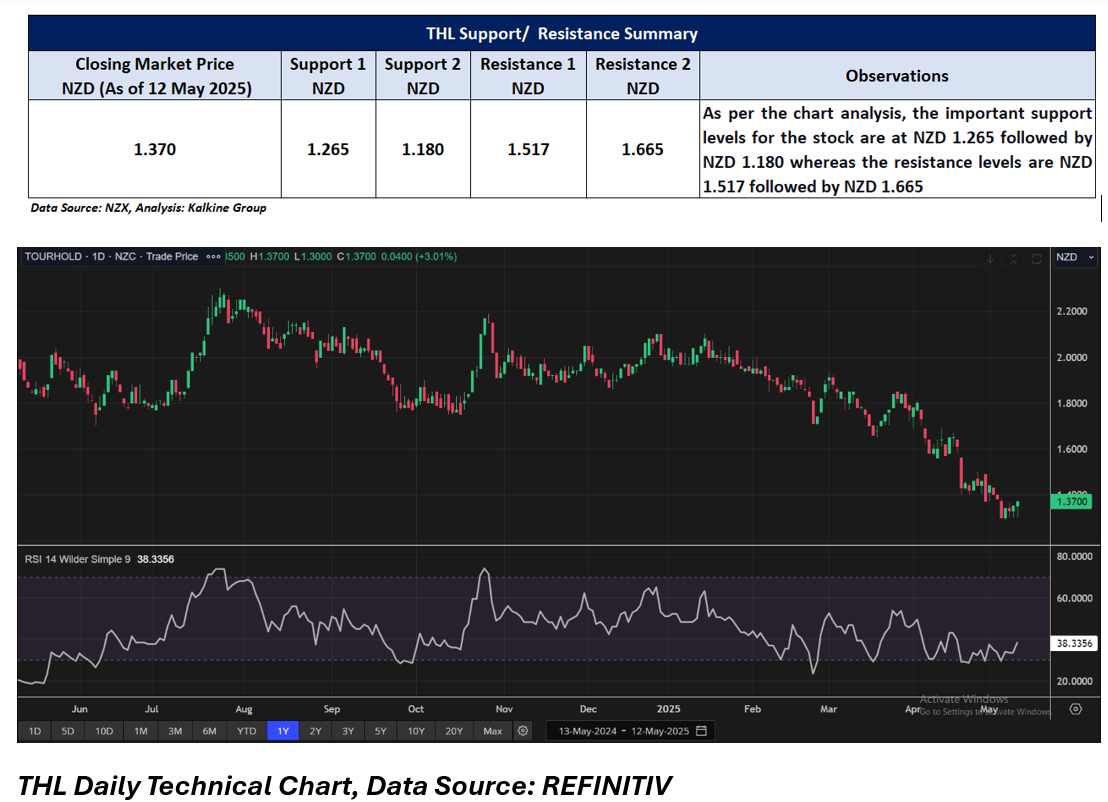
THL shares closed 3.01% higher at NZD 1.37 per share on 12 May 2025. Over the past year, THL’s share price has dropped by almost 32.50% and in the three months, the share price has dropped by 29.69%.
52-week high of THL is NZD 2.30, recorded on 24 July 2024 and 52-week low is NZD 1.29, recorded on 7 May 2025.
Resistance and support summary
Note 1: Past performance is not a reliable indicator of future performance.
Note 2: The reference date for all price data, currency, technical indicators, support, and resistance levels is 12 May 2025. The reference data in this report has been partly sourced from EODHD/Others.
Technical Indicators Defined:
Support: A level at which the stock prices tend to find support if they are falling, and a downtrend may take a pause backed by demand or buying interest. Support 1 refers to the nearby support level for the stock and if the price breaches the level, then Support 2 may act as the crucial support level for the stock.
Resistance: A level at which the stock prices tend to find resistance when they are rising, and an uptrend may take a pause due to profit booking or selling interest. Resistance 1 refers to the nearby resistance level for the stock and if the price surpasses the level, then Resistance 2 may act as the crucial resistance level for the stock.


_12_18_2025_13_13_17_985559.png)

 Please wait processing your request...