_07_25_2025_10_33_04_758484.jpg)
Image source: © 2025 Krish Capital Pty.Ltd
Highlights
- Thematic ETFs like HACK, SEMI, and GXAI offer cost-efficient exposure to megatrends in cybersecurity, semiconductors, and AI.
- HACK has surged 36.59% in the past year, led by top holdings like Broadcom, Cisco, and Palo Alto Networks.
- SEMI delivers focused access to chip leaders, including TSMC, Broadcom, and NVIDIA.
- GXAI has gained 25.92% over the past year, tapping into global AI growth through firms like Tencent and Palantir.
Exchange Traded Funds (ETFs) provide diversified, transparent, and cost-effective access to global megatrends. This article provides a comparative overview of three thematic ETFs, HACK, SEMI, and GXAI, highlighting their objectives, key attributes, recent performance, and top holdings. These funds offer cost-effective exposure to the fast-growing sectors of cybersecurity, semiconductors, and artificial intelligence, enabling market participants to tap into long-term global technology trends through diversified portfolios.
Global Cybersecurity ETF (HACK)
HACK offers a cost-effective access to leading and emerging global cybersecurity companies, aiming to track an index that captures growth in this vital, fast-expanding sector amid rising cybercrime threats.
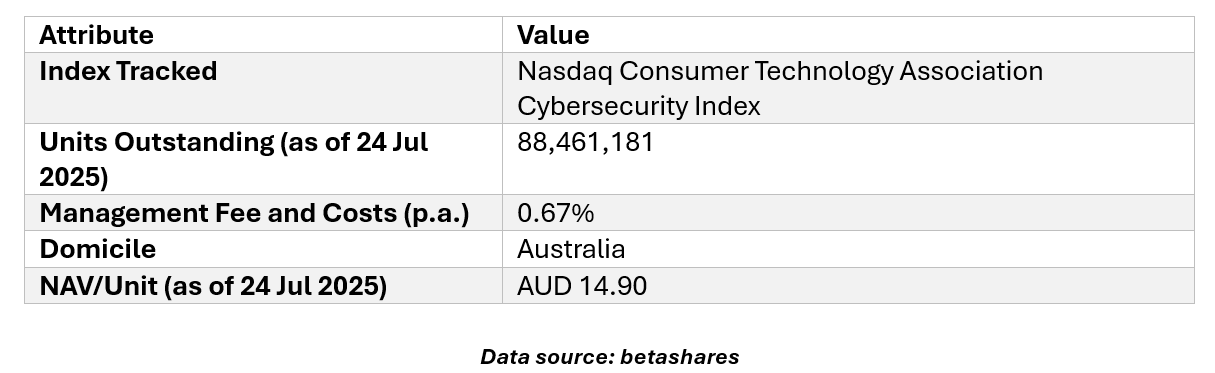
As of 30 June 2025, HACK has delivered notable long-term performance, returning 36.59% over 1 year and 19.10% p.a. since inception, closely tracking its benchmark cybersecurity index.
The HACK ETF portfolio is heavily weighted towards leading global cybersecurity firms. Its top 10 holdings, led by Broadcom (9.2%), Cisco (8.3%), and Palo Alto Networks (8.1%), represent a diversified mix of software, services, and infrastructure providers in the cybersecurity ecosystem.
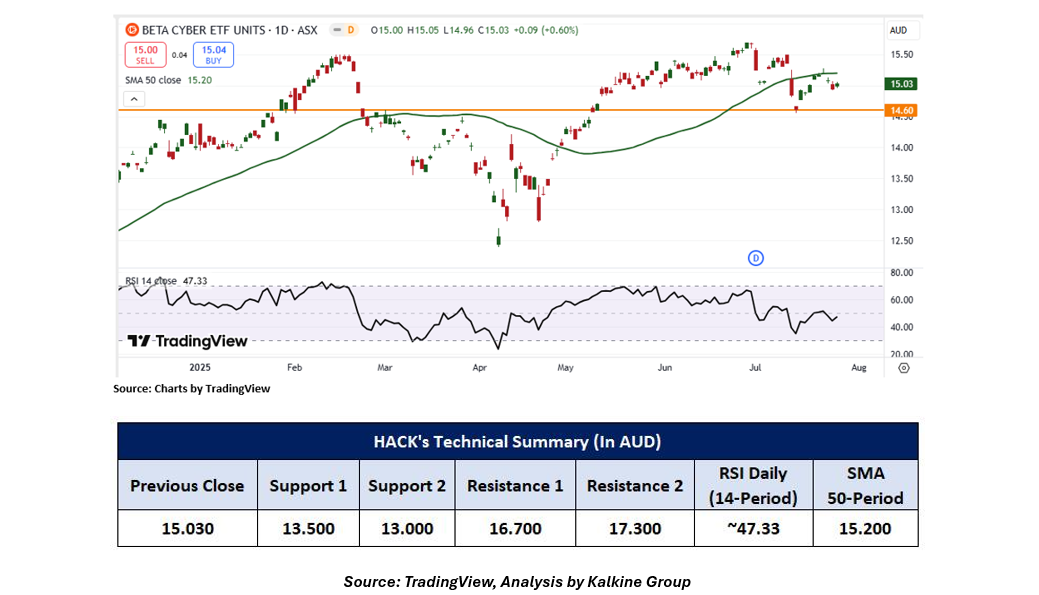
On the daily chart, prices for the Global Cybersecurity ETF are holding above a well-defined horizontal trendline support, signalling that buyers are stepping in to defend this level and hinting at a potential shift in near-term momentum. The ETF’s ability to consistently respect this support reinforces the case for stabilisation after the recent pullback and suggests that selling pressure may be subsiding as value buyers return. The 14-period Relative Strength Index (RSI) currently sits at approximately 47.33, recovering from lower levels but still just shy of the neutral 50 mark. This gradual upward move in the RSI indicates improving underlying momentum and suggests that market sentiment could be turning more constructive. A decisive push above 50 on the RSI would strengthen the bullish case, confirming that buyers are regaining control and setting the stage for a potential trend reversal or continued rebound. However, a key headwind remains: the ETF is still trading below its 50-period Simple Moving Average (SMA) on the daily chart. This signals that the broader trend remains under some pressure, and the 50-SMA now acts as a dynamic resistance level that must be cleared to fully validate any sustained bullish move.
Global X Semiconductor ETF (SEMI)
SEMI offers exposure to global semiconductor leaders driving the future of technology, aiming to track the Solactive Global Semiconductor 30 Index amid growing demand for chips across industries.
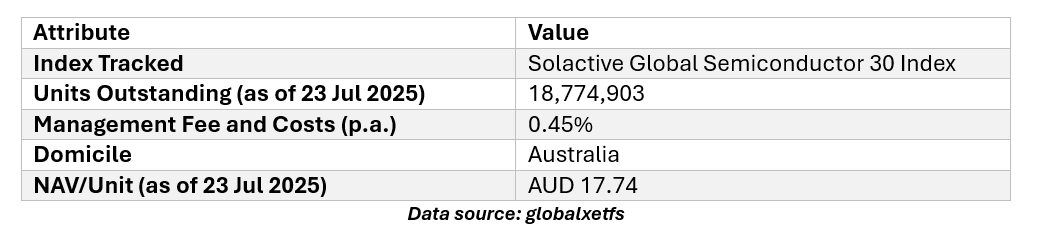
As of 23 July 2025, SEMI has delivered a 1-year return of 9.33% and a 19.36% p.a. return since inception. The ETF has closely tracked its benchmark with a minimal tracking difference of -0.52%.
The SEMI ETF portfolio is concentrated in top global semiconductor names. TSMC (11.83%), Broadcom (11.04%), and NVIDIA (10.76%) lead the fund, offering diversified exposure across foundries, chip designers, and fabrication equipment providers.
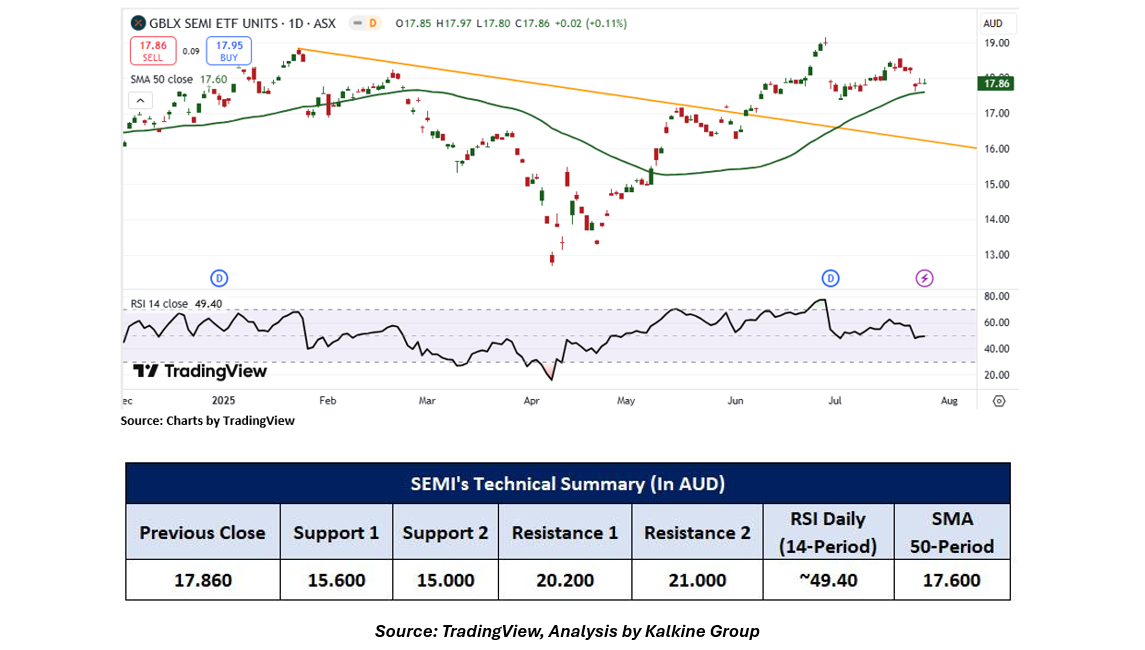
On the daily chart, prices for the Semiconductor ETF are holding above a downward-sloping trendline support, signalling that buyers are defending this level and hinting at a potential shift in momentum. The ETF’s ability to consistently respect this support reinforces the case for continued strength and suggests that the recent pullback may be stabilising. The 14-period Relative Strength Index (RSI) is currently around 49.40, recovering from lower levels. While the RSI remains just below the neutral 50 mark, its upward movement reflects improving momentum and hints at a possible transition from consolidation to a renewed bullish phase if follow-through buying emerges. Adding to the constructive technical setup, the ETF is trading above its 50-period Simple Moving Average (SMA). The 50-SMA is a widely followed trend indicator and now acts as a dynamic support level. Sustained trading above this moving average suggests that medium-term trend conditions remain intact, providing an additional layer of confidence for bulls.
Global X Artificial Intelligence ETF (GXAI)
GXAI provides targeted exposure to companies advancing or benefiting from AI and big data technologies, aiming to track the Indxx Artificial Intelligence & Big Data Index amid accelerating global AI adoption.
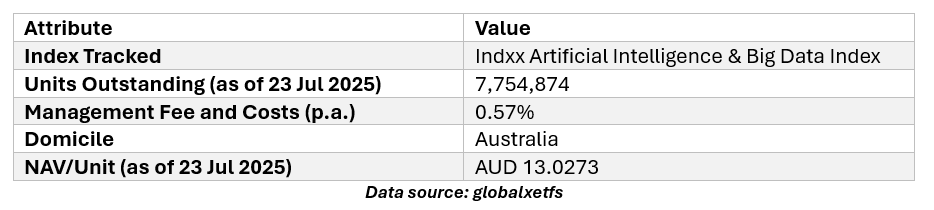
As of 23 July 2025, GXAI has returned 25.92% over 1 year and 24.32% p.a. since inception, closely aligning with its benchmark. The fund demonstrates a minimal tracking difference of -0.77%.
The GXAI ETF portfolio spans global tech giants driving AI and data innovation. Leading holdings include Tencent (3.94%), Palantir (3.73%), and Oracle (3.55%), offering diversified exposure across software, cloud infrastructure, and AI-enabling platforms.
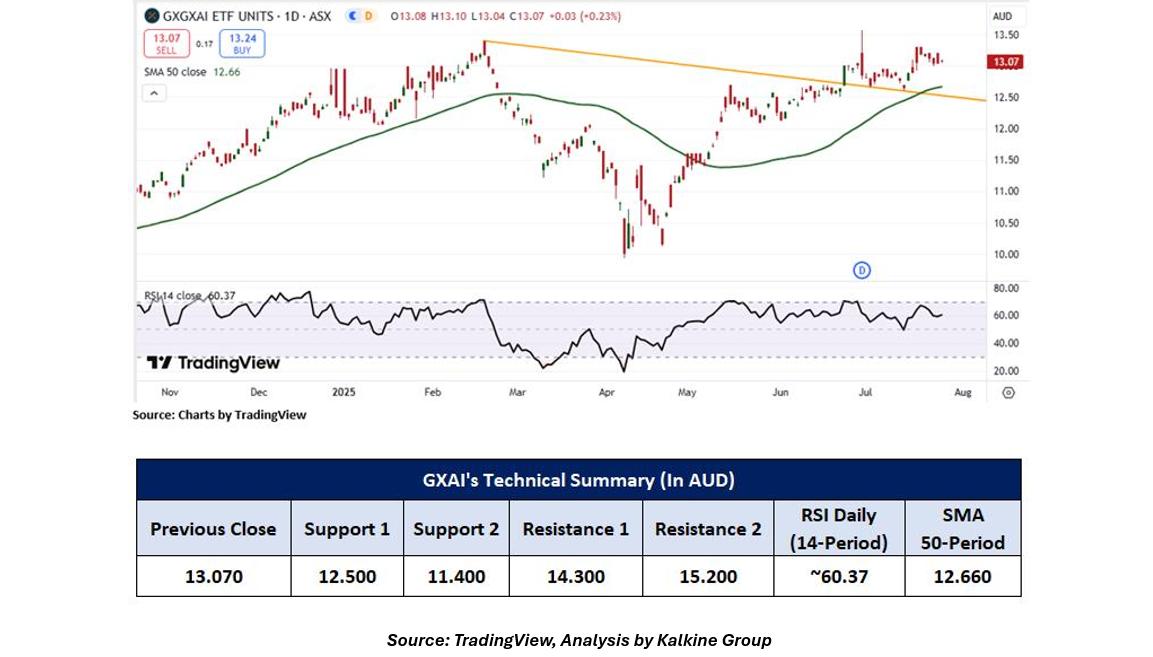
On the daily chart, prices for the Artificial Intelligence ETF continue to hold above a falling trendline support, signalling that buyers are defending this critical level and hinting at the potential for a trend reversal or sustained upside momentum. The ETF’s ability to consistently maintain this support suggests underlying strength and market participants’ willingness to accumulate on dips. Adding to the bullish bias, the 14-period Relative Strength Index (RSI) is in positive territory, currently around 60.37. This level indicates that momentum remains firmly on the side of the bulls, with room to move higher before entering overbought conditions. The rising RSI near this zone often points to strengthening buying pressure. Additionally, the ETF is trading above its 50-period Simple Moving Average (SMA), a widely watched trend-following indicator that now acts as dynamic support. This alignment reinforces the prevailing bullish structure, as the 50-SMA often attracts technical buyers and signals that medium-term trend conditions remain favourable
It's important to remember that past performance is not a reliable indicator of future results. When selecting an ETF, it's essential to consider individual sector preferences, risk tolerance, and the specific performance of the underlying index.
Technical Indicators Defined: -
Support: A level at which the ETF prices tend to find support if they are falling, and a downtrend may take a pause, backed by demand or buying interest. Support 1 refers to the nearby support level for the ETF and if the price breaches the level, then Support 2 may act as the crucial support level for the ETF.
Resistance: A level at which the ETF prices tend to find resistance when they are rising, and an uptrend may pause due to profit booking or selling interest. Resistance 1 refers to the nearby resistance level for the ETF, and if the price surpasses the level, then Resistance 2 may act as the crucial resistance level for the ETF.
Abbreviations
CMP: Current Market Price
SMA: Simple Moving Average
RSI: Relative Strength Index
AUD: Australian Dollar


_12_18_2025_13_13_17_985559.png)

 Please wait processing your request...