
Image source: © 2025 Krish Capital Pty. Ltd.
Highlights
- Operating cash flows of SUM increased by 11.30% YoY to NZD 443.2 million in FY2024, marking a new record.
- Net profit after tax declined by 20.10% YoY to NZD 339.8 million in FY2024.
- Expansion continued, with more than 1,150 new units added to the land bank across four regions in New Zealand in 2024.
Summerset Group Holdings Limited (NZX:SUM)is the third largest operator and the second largest developer of retirement villages and aged care facilities in New Zealand. In the financial year 2024, the company delivered higher revenue and operating cash flows despite reporting a decline in net profit after tax.
Financial Performance
For the year ended 2024, Summerset reported a net profit after tax of NZD 339.8 million, a decrease of 20.10% from NZD 425.3 million in 2023. The decline was largely attributed to fair value movements of investment properties recognised in 2024 compared to the prior year.
In contrast, operating cash flows reached a record NZD 443.2 million, up 11.30% from NZD 398.2 million in FY2023. The increase included a record resales cash flow of NZD 138.2 million, alongside a realised development margin of NZD 118.4 million.
During the reported period, the company recorded a higher total revenue of NZD 319.9 million, compared to NZD 272.2 million in FY2023. Furthermore, the company saw an increase in care fees and village services, which rose to NZD 197.1 million from NZD 165.9 million in the previous year.
However, total income for the year declined slightly to NZD 692.4 million, compared to NZD 702.7 million in FY2023, while expenses rose significantly to NZD 310.3 million, up from NZD 263.7 million.
Operational Update
In 2024, over 1,150 total units were added to the company’s land bank across four separate regions in New Zealand. The management highlighted a continued prudent approach to balance sheet management.
Share performance of SUM
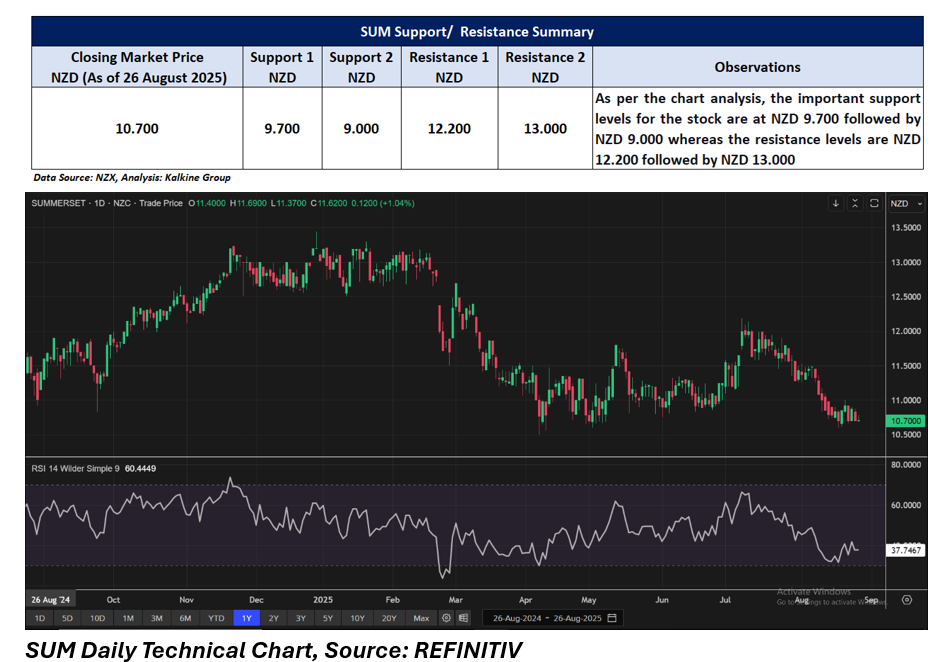
SUM shares closed at NZD 10.70 on 26 August 2025, unchanged on the day. Year-to-date, the stock has declined 18.38%. It is down 9.25% over one month, 8.70% over six months, and 7.91% over the past year. The shares have also lost 4.46% over three months, 17.69% over nine months, and 1.56% in the past week.
The 52-week high for SUM is NZD 13.44, recorded on 30 December 2024, while the 52-week low is NZD 10.50, reached on 7 April 2025
Support and Resistance Summary
Note 1: Past performance is neither an Indicator nor a guarantee of future performance.
Note 2: The reference date for all price data, and currency, is 26 August 2025. The reference data in this report has been partly sourced from EODHD/Others.
Technical Indicators Defined:
Support: A level at which the stock prices tend to find support if they are falling, and a downtrend may take a pause backed by demand or buying interest. Support 1 refers to the nearby support level for the stock and if the price breaches the level, then Support 2 may act as the crucial support level for the stock.
Resistance: A level at which the stock prices tend to find resistance when they are rising, and an uptrend may take a pause due to profit booking or selling interest. Resistance 1 refers to the nearby resistance level for the stock and if the price surpasses the level, then Resistance 2 may act as the crucial resistance level for the stock.


_12_18_2025_13_13_17_985559.png)

_11_27_2025_13_17_04_571639.png)
 Please wait processing your request...