
Image source: Shutterstock
Highlights
- EBITDA of STU declined by 39.44% YoY to NZD 31.4 million in FY24.
- Profit after tax fell sharply to NZD 2.64 million in FY24, compared to NZD 16.99 million in FY23.
- Quick ratio increased to 1.36x in FY24, indicating efficient liquidity management.
Steel & Tube Holdings Limited (NZX:STU) is a leading New Zealand-based provider of steel solutions, operating within the Metals & Mining industry. In the financial year 2024 (FY24), the company’s EBITDA saw a notable decline of 39.44% YoY to NZD 31.4 million from NZD 51.9 million in FY 2023. Similarly, profit after tax fell significantly to NZD 2.64 million, compared to NZD 16.99 million in the previous year.
Despite the decline in profitability, Steel & Tube reported significant improvement in gross margin dollars/tonne through strict cost controls and improved product mix. The gross margin increased to 21.7% in FY24, up from 21.1% in the previous corresponding period.
Meanwhile, the quick ratio improved to 1.36x in FY24 from 1.24x in FY23. However, the debt-to-equity ratio rose to 0.57x from 0.48x, reflecting an increase in financial leverage.
Strategic Outlook
Looking ahead, Steel & Tube expects to benefit from an anticipated recovery in economic activity. The company has been actively investing in digital technology, modern equipment, and growth initiatives.
Top 10 shareholders of STU
The top 10 shareholders of STU collectively hold approximately 30.20% of the company’s stake. New Zealand Steel Limited and Lennon Holdings Limited have the highest stake in the company with a shareholding of 15.62% and 5.70%, respectively.
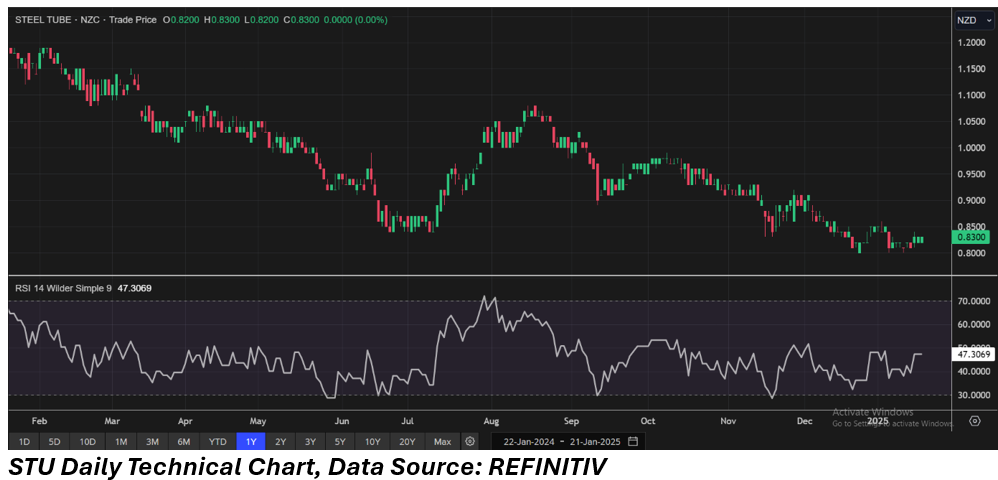
Share performance of STU
STU shares closed at NZD 0.83 per share on 21 January 2025. Over the past year, STU’s share price has dropped by almost 29.67% and in the last three months, the share price has declined by 11.70%.
52-week high of STU is NZD 1.19, recorded on 7 February 2024 and 52-week low is NZD 0.80, recorded on 14 January 2025.
Note 1: Past performance is not a reliable indicator of future performance.
Note 2: The reference date for all price data, currency, technical indicators, support, and resistance levels is January 21, 2025. The reference data in this report has been partly sourced from EODHD/Others.


_12_18_2025_13_13_17_985559.png)

 Please wait processing your request...