
Image source: Shutterstock
Highlights
- Gold remains a globally trusted inflation hedge, with prices reaching record highs in recent years
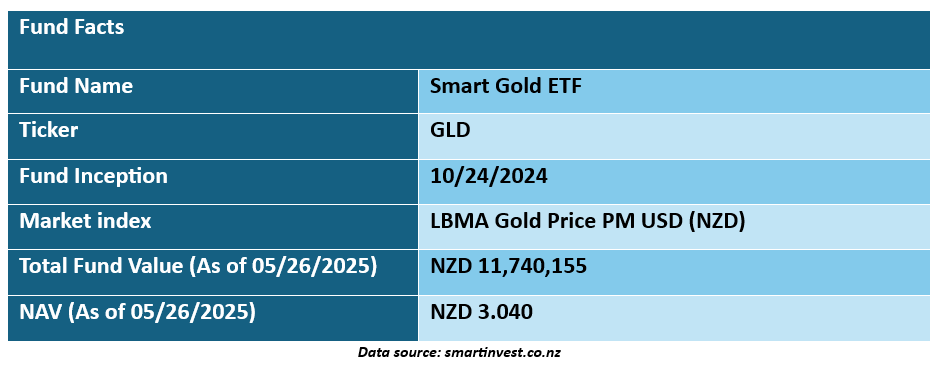
- The Smart Gold ETF tracks the iShares Gold Trust, offering direct exposure to gold without physical storage hassles
- After accounting for a 28% tax, GLD’s investor returns stood at 3.86% for one month and 12.63% for three months
Gold continues to attract significant attention from traders, investors, and central banks worldwide, reaffirming its status as a timeless financial asset. Despite its characteristic price volatility, gold has surged to record levels in recent years, highlighting its enduring role as a trusted store of value and inflation hedge.
The SmartGold ETF tracks the iShares Gold Trust and closely mirrors gold’s market price, offering investors direct exposure to the precious metal without the complexities of physical ownership.
Smart is a leading investment fund manager in Aotearoa New Zealand, rebranded from Smartshares in October 2024.
Over the past one and three months, GLD’s returns before fees and taxes were 4.03% and 13.11%, respectively, while after fees (but before tax), returns slightly decreased to 4.01% and 13.03%. After accounting for a 28% tax, investor returns stood at 3.86% for 1 month and 12.63% for 3 months.
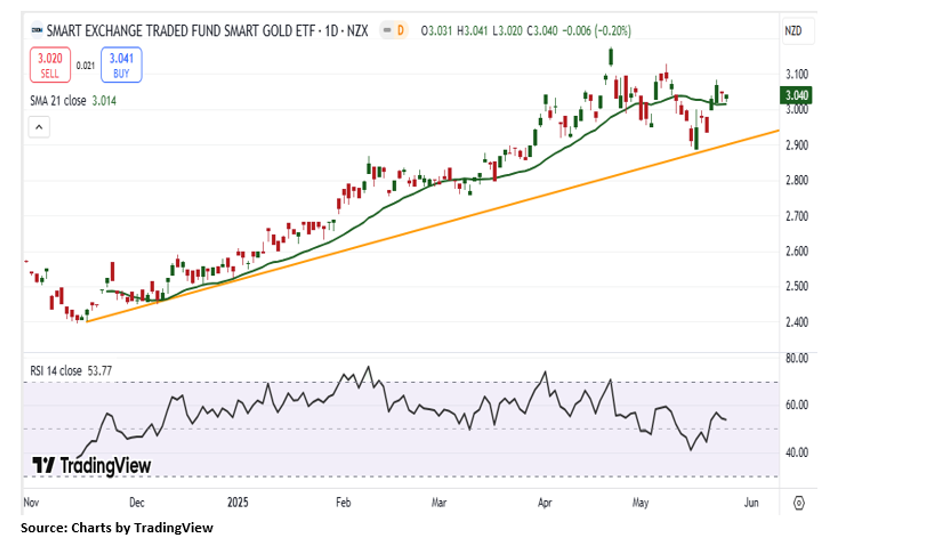
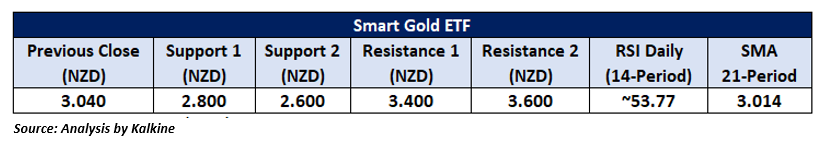
On the daily chart, GLD prices are trading firmly above a rising trendline, indicating the potential for a continuation of the current upward momentum. This trendline has consistently acted as a reliable support level, further reinforcing the bullish technical outlook. The 14-period Relative Strength Index (RSI) is currently at 53.77, reflecting a bullish bias in price momentum while remaining in neutral territory suggesting room for additional upside. Moreover, GLD is trading above its 21-period Simple Moving Average (SMA), a key trend-following indicator that is now serving as dynamic support, lending further strength to the prevailing uptrend.
It's important to remember that past performance is not a reliable indicator of future results. When selecting an ETF, it's essential to consider individual sector preferences, risk tolerance, and the specific performance of the underlying index.
Technical Indicators Defined: -
Support: A level at which the stock prices tend to find support if they are falling, and a downtrend may take a pause backed by demand or buying interest. Support 1 refers to the nearby support level for the stock and if the price breaches the level, then Support 2 may act as the crucial support level for the stock.
Resistance: A level at which the stock prices tend to find resistance when they are rising, and an uptrend may take a pause due to profit booking or selling interest. Resistance 1 refers to the nearby resistance level for the stock and if the price surpasses the level, then Resistance 2 may act as the crucial resistance level for the stock.
Abbreviations
CMP: Current Market Price
SMA: Simple Moving Average
AUD: Australian Dollar
RSI: Relative Strength Index


_12_18_2025_13_13_17_985559.png)

 Please wait processing your request...