
Highlights
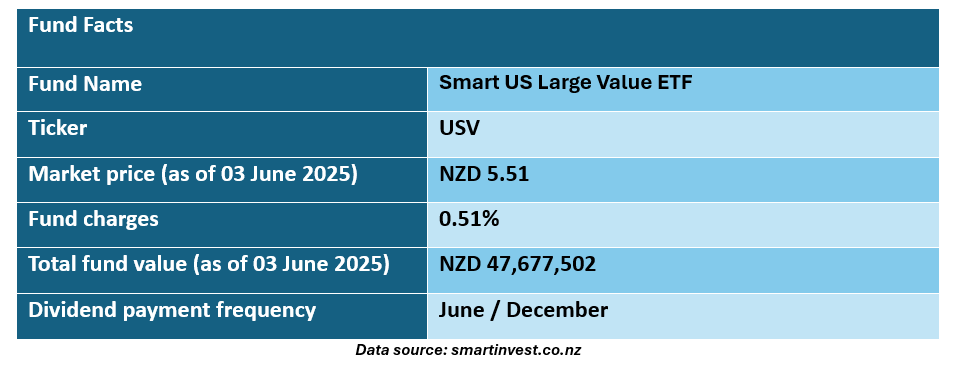
- The Smart US Large Value ETF tracks the CRSP US Large Cap Value Index, focusing on large-cap U.S. value stocks.
- As of 30 April 2025, the ETF delivered a 1-year return of 6.15% (net of fees and 28% tax).
- The ETF currently offers a dividend yield of 2.43%, with distributions in June and December.
The Smart US Large Value ETF is designed to track the performance of the CRSP US Large Cap Value Index, which comprises large-cap U.S. companies with value characteristics. As of 30 April 2025, the fund has delivered an investor return (net of fees and taxed at 28%) of 6.15% over the past year and 8.59% over the past three years. Since its inception on 29 July 2015, the ETF has provided exposure to international equities within the value segment of the U.S. market. It currently offers a dividend yield of 2.43%.
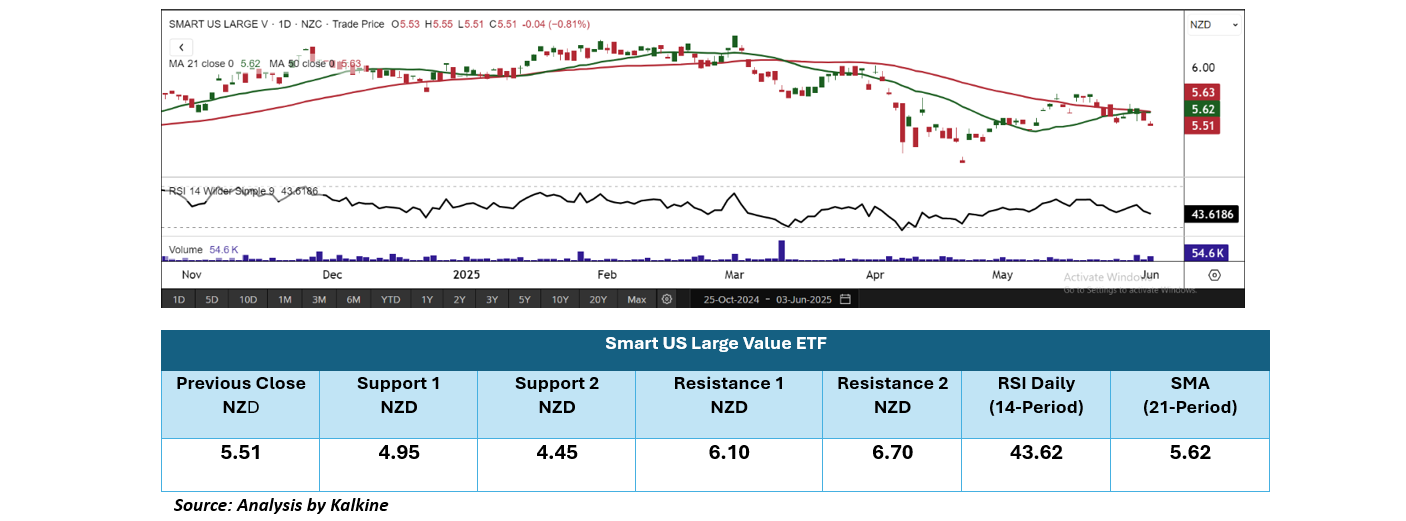
The USV ETF is currently trading below a key support level, signaling potential short-term bearish momentum. The 14-period RSI is positioned below the 50 mark, reinforcing downside pressure. Increasing trading volumes add weight to the negative sentiment. Additionally, the ETF remains under its 21-day Simple Moving Average, which now serves as immediate resistance. A move above this level could signal a shift in momentum and open the path for further upside. Key resistance levels are seen at NZD 6.10 and 6.70, while strong support lies at NZD 4.95 and 4.45.
It's important to remember that past performance is not a reliable indicator of future results. When selecting an ETF, it's essential to consider individual sector preferences, risk tolerance, and the specific performance of the underlying index.
Technical Indicators Defined: -
Support: A level at which the stock prices tend to find support if they are falling, and a downtrend may take a pause backed by demand or buying interest. Support 1 refers to the nearby support level for the stock and if the price breaches the level, then Support 2 may act as the crucial support level for the stock.
Resistance: A level at which the stock prices tend to find resistance when they are rising, and an uptrend may take a pause due to profit booking or selling interest. Resistance 1 refers to the nearby resistance level for the stock and if the price surpasses the level, then Resistance 2 may act as the crucial resistance level for the stock.
Abbreviations
CMP: Current Market Price
SMA: Simple Moving Average
AUD: Australian Dollar
RSI: Relative Strength Index


_12_18_2025_13_13_17_985559.png)

_11_27_2025_13_17_04_571639.png)
 Please wait processing your request...