
Image source: © 2025 Krish Capital Pty.Ltd
Highlights
- Smart Bitcoin ETF has delivered a +20.63% return over the past 3 months as of 30 June 2025.
- The fund’s 99.96% allocation to iShares Bitcoin Trust ETF (IBIT US) provides near-pure Bitcoin exposure.
- Not suited for all market participants due to Bitcoin’s inherent volatility and crypto market risks.
The Smart Bitcoin ETF provides indirect exposure to the price movements of Bitcoin by investing in the iShares Bitcoin Trust ETF. This fund targets those who understand and are comfortable with the risks of the volatile cryptocurrency market, aiming to mirror the performance of Bitcoin as tracked by the CME CF Bitcoin Reference Rate (New York Variant, NZD).
Fund Snapshot
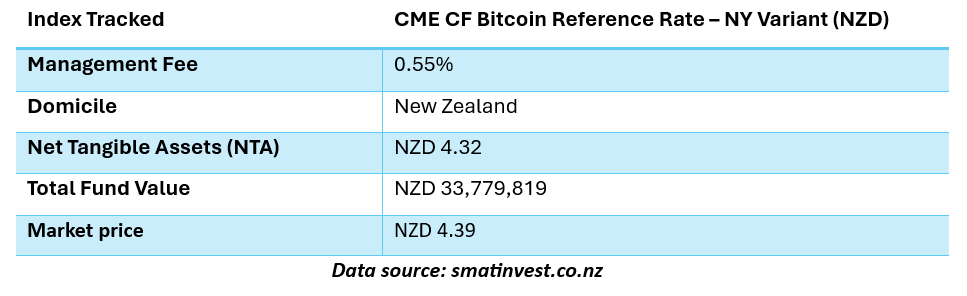
Performance Summary (as of 30 June 2025)
Over the past three months, the Smart Bitcoin ETF delivered a 20.63% return (after fees, before tax), closely aligning with the underlying iShares Bitcoin Trust ETF performance of 20.74%. The fund showed a slight 1-month decline of -0.15%, reflecting short-term volatility. One-year and longer-term returns are not yet available, as the fund launched on 24 October 2024.
Holdings Overview (as of 30 June 2025)
The fund is almost entirely allocated to the iShares Bitcoin Trust ETF (IBIT US), which makes up 99.96% of the portfolio. The remainder includes small positions in NZD and USD cash accounts held with ANZ and BNP Paribas, respectively.
Technical Snapshot
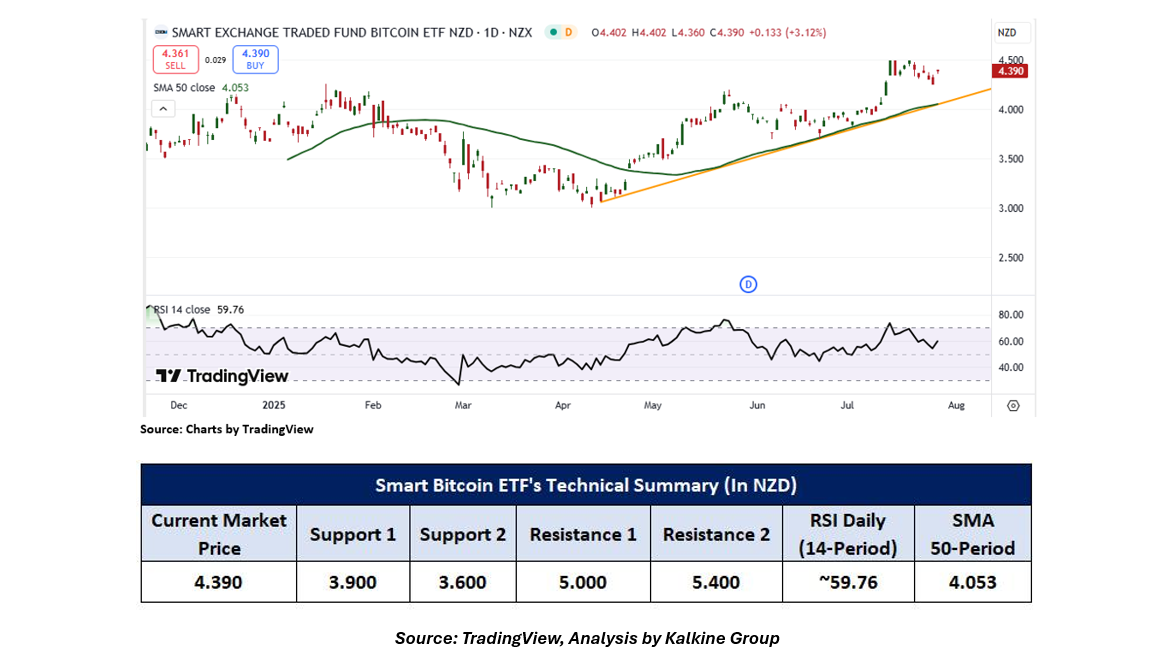
On the daily chart, the Smart Bitcoin ETF continues to show resilience, with prices holding above the rising trendline support, indicating the preservation of its near-term uptrend. This sustained positioning above trendline support suggests that bullish sentiment remains intact, and buyers are stepping in during dips. Adding to the constructive outlook, the 14-period Relative Strength Index (RSI) is currently at ~59.76, reflecting bullish momentum. While not in overbought territory, this RSI level indicates that upside momentum is building, with room for further price appreciation. Importantly, prices are also trading above the 50-period Simple Moving Average (SMA) a key trend-following indicator. This reinforces the bullish structure and positions the 50-SMA as a dynamic support level, potentially acting as a springboard for further upside if retested.
It's important to remember that past performance is not a reliable indicator of future results. When selecting an ETF, it's essential to consider individual sector preferences, risk tolerance, and the specific performance of the underlying index.
Technical Indicators Defined: -
Support: A level at which the ETF prices tend to find support if they are falling, and a downtrend may take a pause, backed by demand or buying interest. Support 1 refers to the nearby support level for the ETF and if the price breaches the level, then Support 2 may act as the crucial support level for the ETF.
Resistance: A level at which the ETF prices tend to find resistance when they are rising, and an uptrend may pause due to profit booking or selling interest. Resistance 1 refers to the nearby resistance level for the ETF, and if the price surpasses the level, then Resistance 2 may act as the crucial resistance level for the ETF.
Abbreviations
CMP: Current Market Price
SMA: Simple Moving Average
RSI: Relative Strength Index
NZD: New Zealand Dollar
Risk Disclosure: Trading in cryptocurrencies involves high risks including the risk of losing some, or all, of your investment amount, and may not be suitable for all investors. Prices of cryptocurrencies are extremely volatile and may be affected by external factors such as financial, regulatory, or political events. The laws that apply to crypto products (and how a particular crypto product is regulated) may change. Before deciding to trade in financial instrument or cryptocurrencies you should be fully informed of the risks and costs associated with trading in the financial markets, carefully consider your investment objectives, level of experience, and risk appetite, and seek professional advice where needed. Kalkine Media cannot and does not represent or guarantee that any of the information/data available here is accurate, reliable, current, complete or appropriate for your needs. Kalkine Media will not accept liability for any loss or damage as a result of your trading or your reliance on the information shared on this website.


_12_18_2025_13_13_17_985559.png)

 Please wait processing your request...