
Image source: Shutterstock
Highlights
- In FY25, Ryman reported NZD 760.7 million in revenue and a net loss of NZD 436.8M.
- EBITDAF up NZD 30.7 million inn FY25, driven by improvements in village and non-village performance.
- Ryman’s FY26 outlook emphasises operational efficiency, cash flow improvement, and cost reduction.
Ryman Healthcare Limited (ASX:RYM) is New Zealand’s largest retirement living provider and offers independent and serviced living plus care services. It operates in 30 villages across NZ and Australia, housing over 10,000 residents and employing 4,000+ staff.
Recent Financial Performance
In the financial year 2025 (FY25), the company reported revenue of NZD 760.7 million and a net loss of NZD 436.8 million, impacted by one-off costs, non-cash asset write-downs, and higher interest expenses. Net tangible assets (NTA) per share fell to 418.2 cps on 31 March 2025, down from 589.7 cps on 30 September 2024, primarily due to changes in valuation and cost capitalisation methods under financial reporting, as well as the issuance of additional shares following an equity raise. However, group operating EBITDAF rose to NZD 30.7 million, driven by improvements in boh non-village and village performance.
FY25 marked a record construction year, with completions at Miriam Corban, Keith Park, James Wattie, and Bert Newton villages, while Hubert Opperman in Mulgrave opened its first townhouses. The total number of operational villages reached 49. In March 2025, Ryman raised NZD 1.0 billion, reducing net debt by NZD 840 million to NZD 1.665 billion and lowering gearing to 28.1%.
Company Outlook
In FY26, the company expects ORA sales to range between 1,100 and 1,300, down from 1,523 in FY25, but at higher deferred management fee (DMF) rates. Annualised cost savings are targeted to double from NZD 23 million to NZD 46 million by year-end. The projected build rate is 266–330 units, including 80 aged care beds and up to 250 retirement village units, compared to 950 in FY25.
Capital expenditure is expected to fall to NZD 260–320 million, reflecting lower development activity and a more disciplined investment approach.
Share performance of RYM
RYM shares closed 7.88% lower at NZD 2.20 per share on 29 May 2025. With this, in a year, RYM’s share price has dropped by almost 34% and has recorded a drop of 11.60% in a week.
52-week high of RYM is NZD 4.75, recorded on 25 November 2024 and 52-week low is NZD 2.20, recorded on 29 May 2025.
Resistance and support summary
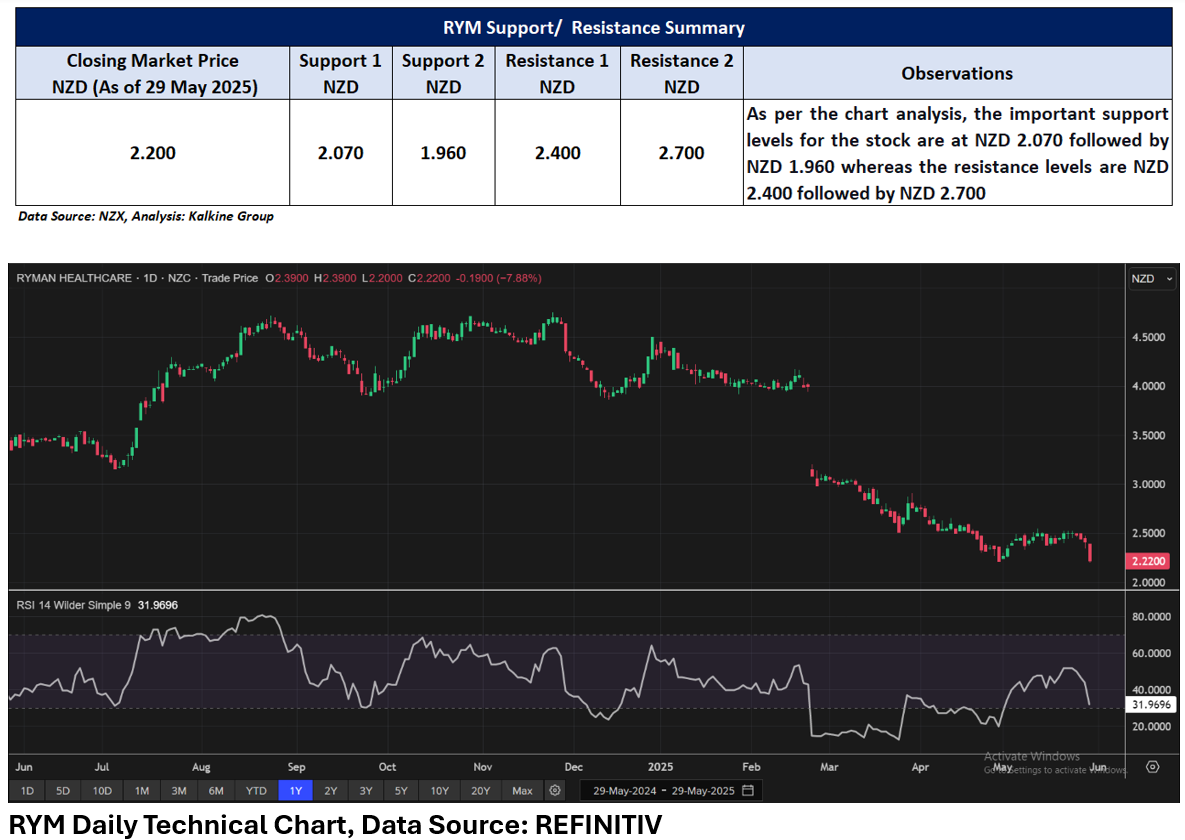
Note 1: Past performance is not a reliable indicator of future performance.
Note 2: The reference date for all price data, currency, technical indicators, support, and resistance levels is 29 May 2025. The reference data in this report has been partly sourced from EODHD/Others.
Technical Indicators Defined:
Support: A level at which the stock prices tend to find support if they are falling, and a downtrend may take a pause backed by demand or buying interest. Support 1 refers to the nearby support level for the stock and if the price breaches the level, then Support 2 may act as the crucial support level for the stock.
Resistance: A level at which the stock prices tend to find resistance when they are rising, and an uptrend may take a pause due to profit booking or selling interest. Resistance 1 refers to the nearby resistance level for the stock and if the price surpasses the level, then Resistance 2 may act as the crucial resistance level for the stock.


_12_18_2025_13_13_17_985559.png)

 Please wait processing your request...