
Image source: © 2025 Krish Capital Pty.Ltd
Highlights
- UPRO and TQQQ aim to deliver triple the daily returns of the S&P 500 and Nasdaq-100, respectively.
- UPRO posted an 18.25% gain over one month but remains down nearly 10% year-to-date.
- TQQQ surged 27.55% in the past month but is still down 11.26% for the year.
Equity indices like the S&P 500 and Nasdaq-100 are essential benchmarks, reflecting the performance of leading U.S. companies and shaping market sentiment and strategies. ProShares offers leveraged ETFs such as UltraPro S&P500 (UPRO) and UltraPro QQQ (TQQQ), designed to deliver three times the daily returns of these indices, for those seeking amplified exposure to key segments of the equity market.
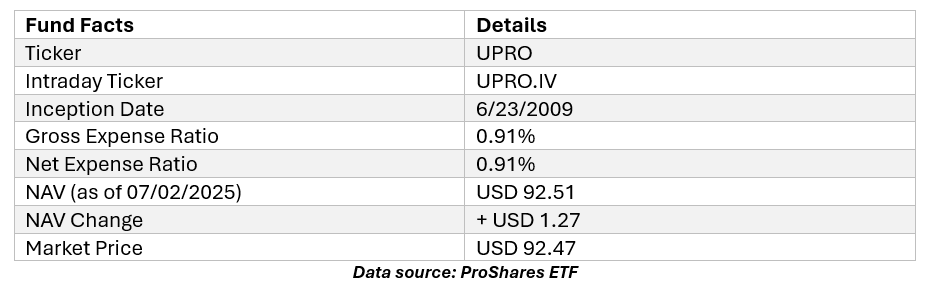
ProShares UltraPro S&P500 (UPRO)
ProShares UltraPro S&P500 aims to deliver daily returns, before fees and expenses, equal to three times (3x) the daily performance of the S&P 500® index.
The S&P 500 Index is designed to measure the performance of 500 of the largest companies listed and domiciled in the U.S.
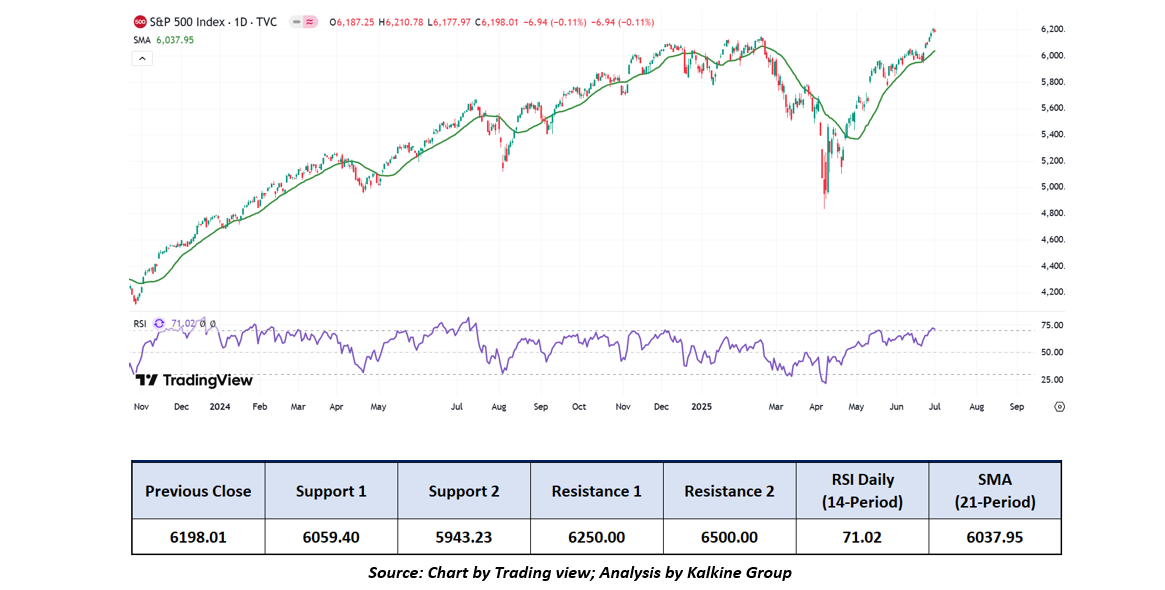
On the daily chart, the S&P 500 Index surpassed its previous peak during an uptrend, indicating a positive bias. Additionally, the RSI (14-period) is heading north from its midpoint, adding more evidence to the previous analysis. Prices are trading above both the 21-period and 50-day SMAs, which may potentially function as dynamic support levels for the stock; in contrast, the stock’s next round level might act as sentimental resistance. Critical support for the stock is positioned at AUD 5,943.23, while significant resistance is placed at 6,500.
UPRO’s top five holdings feature Apple Inc. at 7.02% and Microsoft Corp. at 5.87%, highlighting significant exposure to prominent tech leaders. NVIDIA Corp. holds a 5.58% weight, followed by Amazon.com Inc. at 3.77% and Meta Platforms Inc.-Class A at 2.65%, reflecting the fund’s concentration in influential growth companies.
UPRO delivered a 1-month return of 18.25% at market price but remains down 9.78% year-to-date. Over 10 years, market returns averaged 21.59% annually, closely tracking its NAV performance across all periods.
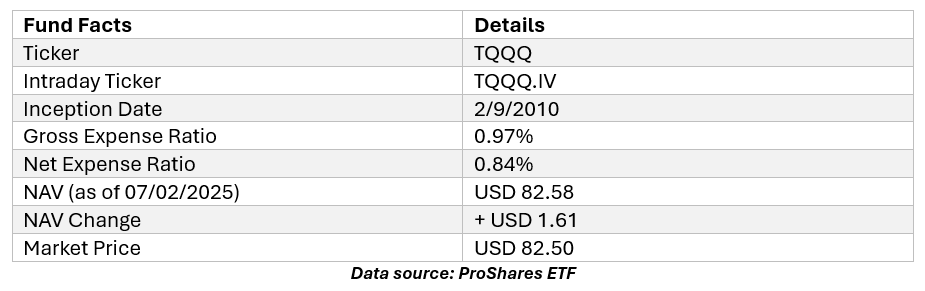
ProShares UltraPro® QQQ (TQQQ)
ProShares UltraPro® QQQ aims to deliver daily returns, before fees and expenses, equal to three times (3x) the daily performance of the Nasdaq-100 Index®.
The Nasdaq-100 Index tracks the performance of 100 of the largest non-financial companies listed on the Nasdaq Stock Market.
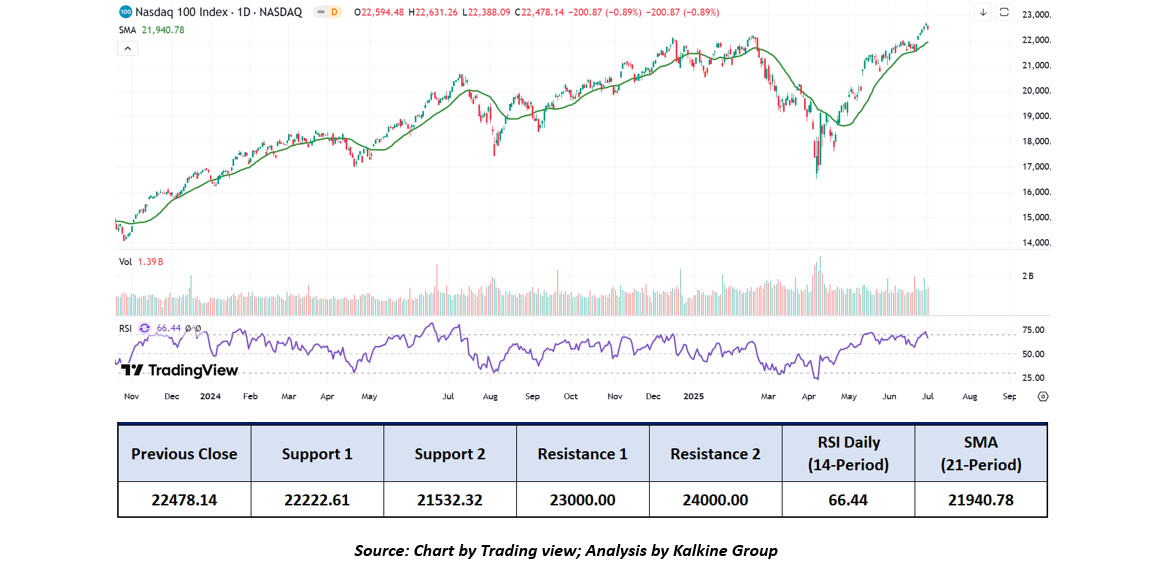
On the daily chart, the Nasdaq 100 Index broke above its previous peak during an uptrend, indicating a positive bias. Moreover, the RSI (14-period) is trading above its midpoint, providing further support for the recommendation mentioned. Prices are trading above both the 21-period and 50-day SMAs, which may potentially function as dynamic support levels for the stock; in contrast, the stock’s next round level might act as sentimental resistance. Crucial support for the stock is positioned at AUD 21,532.32, while key resistance is placed at 24,000.
TQQQ’s top five holdings include Apple Inc. at 9.40% and Microsoft Corp. at 7.86%, reflecting higher exposure to leading technology giants. NVIDIA Corp. follows at 7.45%, with Amazon.com Inc. at 5.68% and Broadcom Inc. at 3.66%, underscoring the fund’s focus on major innovators driving the tech sector.
TQQQ gained 27.55% over one month but remains down -11.26% year-to-date. Its 10-year market return averages 31.28% annually, with long-term performance closely mirrored by its NAV returns across all periods.
However, it's important to remember that past performance is not a reliable indicator of future results. When selecting an ETF, it's essential to consider individual sector preferences, risk tolerance, and the specific performance of the underlying index.
Technical Indicators Defined: -
Support: A level at which the stock prices tend to find support if they are falling, and a downtrend may take a pause backed by demand or buying interest. Support 1 refers to the nearby support level for the stock and if the price breaches the level, then Support 2 may act as the crucial support level for the stock.
Resistance: A level at which the stock prices tend to find resistance when they are rising, and an uptrend may take a pause due to profit booking or selling interest. Resistance 1 refers to the nearby resistance level for the stock and if the price surpasses the level, then Resistance 2 may act as the crucial resistance level for the stock.
Abbreviations
CMP: Current Market Price
SMA: Simple Moving Average
USD: American Dollar
RSI: Relative Strength Index


_12_18_2025_13_13_17_985559.png)

_11_27_2025_13_17_04_571639.png)
 Please wait processing your request...