
Image source: Shutterstock
Highlights
- KMD Brands' FY24 sales fell by 11.2% YoY to NZD 979.4 million, with EBITDA dropping from NZD 200 million to NZD 107.2 million.
- Rip Curl’s DTC sales increased by 2.4% YoY in the first five months of FY25, supported by holiday sales and new store openings.
- Brent Scrimshaw to take responsibilities of Group CEO and Managing Director on 24 March 2025.
KMD Brands Limited (NZX:KMD) is an international outdoor, lifestyle, and sports company. In the financial year 2024 (FY24), KMD Brands reported total sales of NZD 979.4 million, reflecting an 11.2% YoY decline compared to NZD 1,102.9 million in FY23. The cost of sales in FY24 stood at NZD 402.9 million and the company's EBITDA witnessed a significant drop, falling from NZD 200 million in FY23 to NZD 107.2 million in FY24.
Despite financial challenges, KMD Brands experienced notable growth in its Direct-to-Consumer (DTC) sales segment in the first five months of the FY25. Rip Curl’s DTC sales increased by 2.4% YoY for the first five months of FY25, driven by holiday sales and additional store openings.
Additionally, KMD announced a leadership transition, with Brent Scrimshaw set to assume the role of Group CEO and Managing Director on 24 March 2025.
Recent Business Developments
Recently, the company announced its removal from the S&P/ASX All Ordinaries Index, effective 24 March 2025, following the S&P Dow Jones Indices quarterly rebalance.
Future Outlook
Looking ahead, KMD expects H1FY25 underlying EBITDA to be between NZD 1 million – 3 million. The company is targeting positive sales growth in the second half of the financial year, historically the most profitable period.
Share performance of KMD
KMD shares closed at NZD 0.375 per share on 17 March 2025. Over the past year, KMD’s share price has dropped by almost 28.85% and in the last three months, it has recorded a fall of 8.64%.
52-week high of KMD is NZD 0.63, recorded on 27 March 2024 and 52-week low is NZD 0.34, recorded on 1 July 2024.
Resistance and support summary
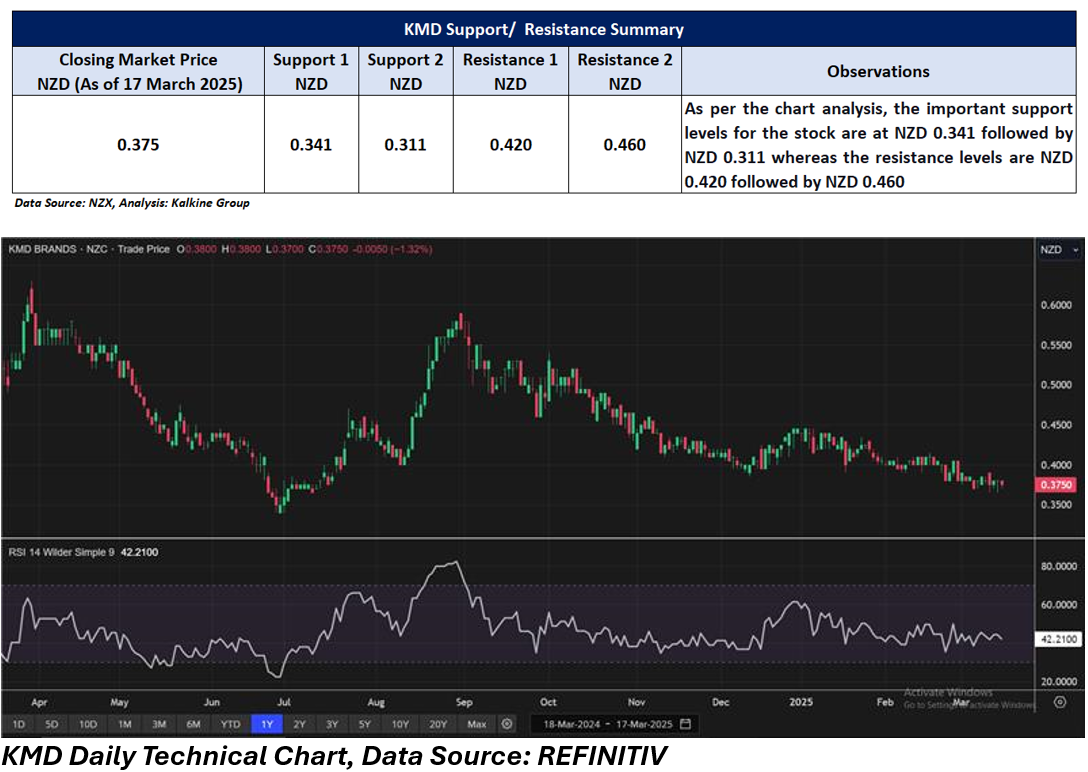
Note 1: Past performance is not a reliable indicator of future performance.
Note 2: The reference date for all price data, currency, technical indicators, support, and resistance levels is 17 March 2025. The reference data in this report has been partly sourced from EODHD/Others.
Technical Indicators Defined:
Support: A level at which the stock prices tend to find support if they are falling, and a downtrend may take a pause backed by demand or buying interest. Support 1 refers to the nearby support level for the stock and if the price breaches the level, then Support 2 may act as the crucial support level for the stock.
Resistance: A level at which the stock prices tend to find resistance when they are rising, and an uptrend may take a pause due to profit booking or selling interest. Resistance 1 refers to the nearby resistance level for the stock and if the price surpasses the level, then Resistance 2 may act as the crucial resistance level for the stock.


_12_18_2025_13_13_17_985559.png)

 Please wait processing your request...