
Image source: © 2025 Krish Capital Pty. Ltd.
Highlights
- KMD reported a loss of NZD 12.7 million in H1FY25, down from a profit of NZD 480,000 in H1FY24.
- Despite earnings decline, gross margin rose to 58.5%, significantly outperforming the industry median of 36.4%.
- EBITDA is forecasted between NZD 15 million and NZD 25 million; net debt expected at ~NZD 70 million by July-end.
KMD Brands Limited (NZX:KMD) is a New Zealand based global lifestyle, outdoor, and sportswear company and faced a significant drop in its earnings before interest and tax in the first half of the financial year 2025 (H1FY25). The company designs, markets, and distributes apparel, footwear, and gear through its portfolio of brands catering to outdoor and surf lifestyles.
Financial Performance in H1FY25
KMD reported mixed performance in the first half of FY25, with earnings before interest and tax (EBIT) slipping to a loss of NZD 12.7 million, down from a profit of NZD 480,000 in the prior corresponding period. Cost of sales remained relatively flat at NZD 195.46 million in H1FY25, slightly up from NZD 192.93 million in H1 FY24.
Despite this, net cash inflow from operating activities improved by 8.5% YoY, rising from NZD 42.2 million to NZD 45.8 million. Notably, incremental operating costs of ~NZD 3 million were incurred by Kathmandu to refresh brand advertising, product innovation, and enhance customer engagement.
During the reported period, net and operating margins turned negative, reaching -4.4% and -2.7%, respectively. Meanwhile, gross margin reached 58.5% in H1 FY25, significantly above the 36.4% industry median. Additionally, EBITDA margin stood at 11.2%, outperforming the 10.6% sector average.
Strategic Outlook
KMD expects full-year FY25 underlying EBITDA in the range of NZD 15 million to NZD 25 million. With direct-to-consumer performance, net debt is projected to be approximately NZD 70 million by 31 July 2025. Notably, direct-to-consumer sales performance is the critical cashflow driver for the remainder of the financial year.
In response to evolving market dynamics, KMD has amended its FCCR and banking covenants, aligning financial flexibility with business needs over the next two measurement periods.
The company stated that all the brands are managing working capital actively and expects inventory to be lower than FY24.
Dividends
Dividends declared rose slightly from NZD 42.5 million in FY22 to NZD 42.7 million in FY23. The company’s dividend policy remains in line with its earnings, with a target payout ratio in the range of 50-70% of underlying NPAT.
Share performance of KMD
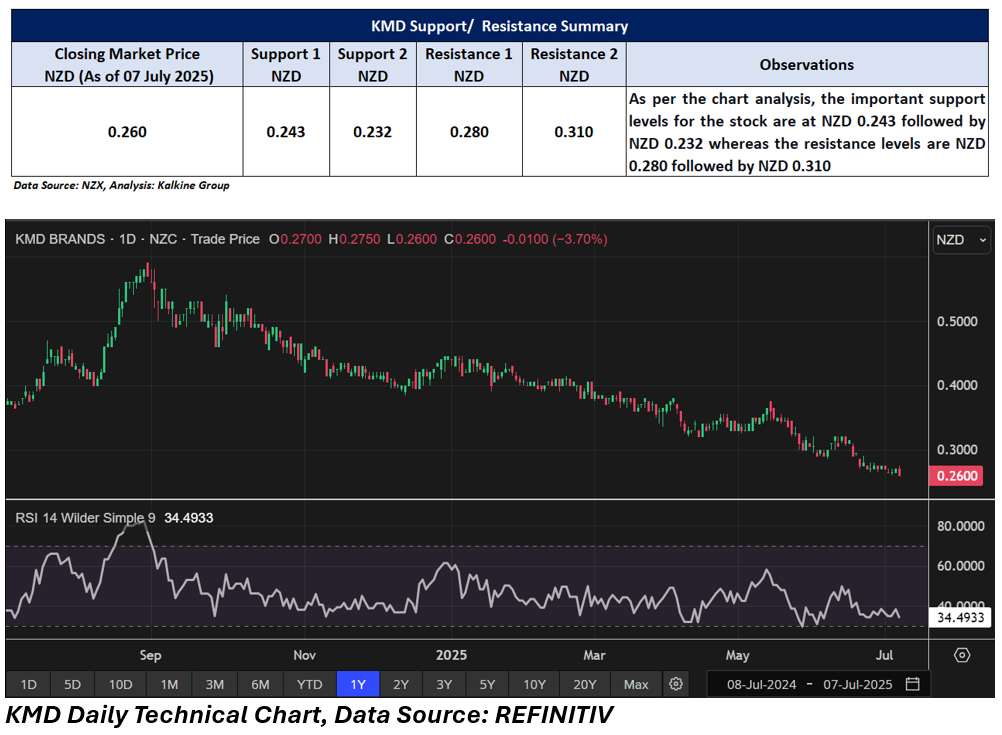
KMD shares closed at NZD 0.26 per share on 7 July 2025. In the last three months, KMD share price has declined by almost 21.7%.
52-week high of KMD is NZD 0.59 and 52-week low is NZD 0.26.
Resistance and Support Summary
Note 1: Past performance is not a reliable indicator of future performance.
Note 2: The reference date for all price data, currency, technical indicators, support, and resistance levels is 07 July 2025. The reference data in this report has been partly sourced from EODHD/Others.
Technical Indicators Defined:
Support: A level at which the stock prices tend to find support if they are falling, and a downtrend may take a pause backed by demand or buying interest. Support 1 refers to the nearby support level for the stock and if the price breaches the level, then Support 2 may act as the crucial support level for the stock.
Resistance: A level at which the stock prices tend to find resistance when they are rising, and an uptrend may take a pause due to profit booking or selling interest. Resistance 1 refers to the nearby resistance level for the stock and if the price surpasses the level, then Resistance 2 may act as the crucial resistance level for the stock.


_12_18_2025_13_13_17_985559.png)

_11_27_2025_13_17_04_571639.png)
 Please wait processing your request...