
Image source: Shutterstock
Highlights
- KPG’s operating profit before tax rose 7.63% YoY to NZD 56.4 million in H1FY25.
- Property revenue climbed 9.2% YoY in H1FY245, reflecting effective asset management and leasing strategy.
- Net profit after tax bounced back to NZD 43.2 million from a loss of NZD 36.5 million in H1 FY2024.
Kiwi Property Group Limited (NZX:KPG)k, New Zealand based property company, delivered encouraging financial metrics in the six months ended 30 September 2024 (H1FY25). The company reported an operating profit before tax of NZD 56.4 million in H1FY25, marking a 7.63% YoY increase from NZD 52.4 million in the corresponding period last year, backed by cost control and execution efficiencies. Property revenue also rose 9.2% YoY to NZD 126.4 million. Most notably, net profit after tax soared to NZD 43.2 million, recovering from a loss of NZD 36.5 million in H1 FY2024.
The group’s gross margin stood at an impressive 75.8% for the half-year period, well above the 67% industry median. Likewise, the EBITDA margin also outperformed peers at 65.9%, compared to the industry average of 63.8%.
However, the net margin was reported at 33.7%, significantly below the 65.2% industry median. Return on equity (ROE) also remained subdued at 2.3%, compared to the industry benchmark of 3.8%.
Outlook
Nonetheless, the company maintained a cautiously optimistic outlook. The occupancy rate across KPG's portfolio remained stable due to proactive lease management, including the use of short-term tenancies and a clear capital allocation strategy. The firm continues to assess its asset base for strategic divestment or reinvestment, focusing on enhancing value from retail-centric, mixed-use developments.
In a notable leadership update, KPG recently appointed Louise Hill to the newly created position of General Manager – Corporate Services.
Top 10 shareholders of KPG
The top 10 shareholders of KPG have around 25.56% shareholding in the company. Accident Compensation Corporation and Milford Asset management Ltd. have highest stake in the company with a shareholding of nearly 10.53% and 6.61%, respectively.
Share performance of KPG
KPG shares closed 1.14% higher at NZD 0.88 per share on 5 May 2025. Over the past year, KPG’s share price increased by almost 10%, while in the last six months, it has declined by around 5.88%.
52-week high of KPG is NZD 1.015, recorded on 18 October 2024 and 52-week low is NZD 0.785, recorded on 6 May 2024.
Resistance and support summary
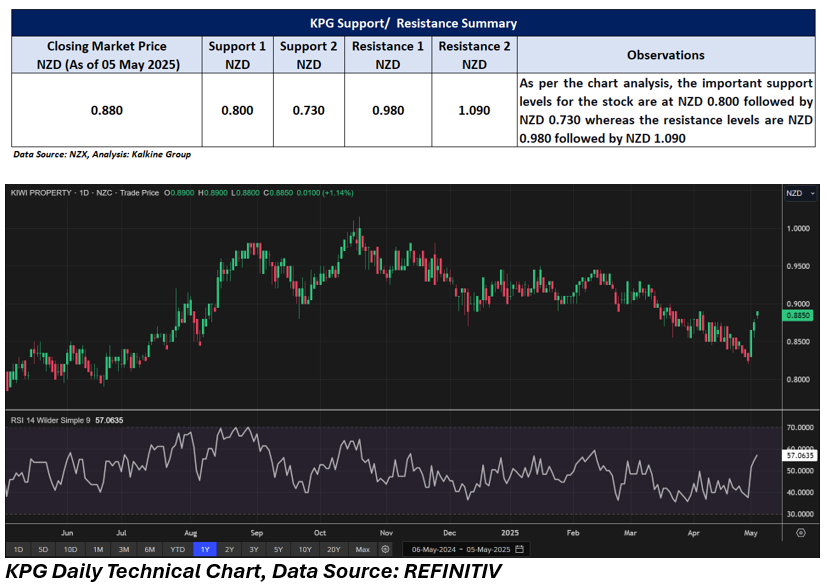
Note 1: Past performance is not a reliable indicator of future performance.
Note 2: The reference date for all price data, currency, technical indicators, support, and resistance levels is 05 May 2025. The reference data in this report has been partly sourced from EODHD/Others.
Technical Indicators Defined:
Support: A level at which the stock prices tend to find support if they are falling, and a downtrend may take a pause backed by demand or buying interest. Support 1 refers to the nearby support level for the stock and if the price breaches the level, then Support 2 may act as the crucial support level for the stock.
Resistance: A level at which the stock prices tend to find resistance when they are rising, and an uptrend may take a pause due to profit booking or selling interest. Resistance 1 refers to the nearby resistance level for the stock and if the price surpasses the level, then Resistance 2 may act as the crucial resistance level for the stock.


_12_18_2025_13_13_17_985559.png)

 Please wait processing your request...