
Image source: Shutterstock
Highlights
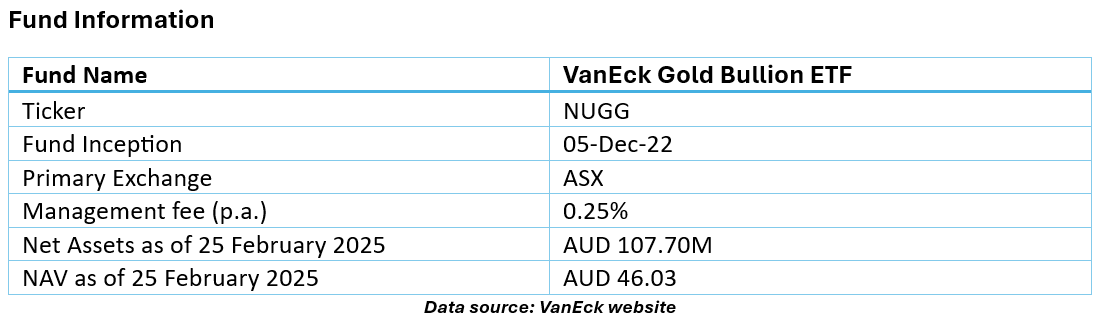
- The VanEck Gold Bullion ETF (ASX: NUGG) is backed by physical Australian-sourced gold bullion, providing a tangible asset
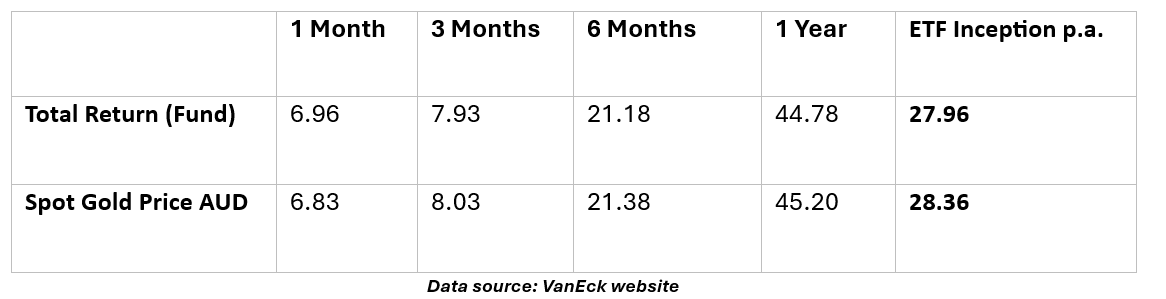
- The fund has provided a total return of around 45% in the past year
- The fund comes with several risks, including gold pricing, currency, custody, liquidity, and operational risks
The VanEck Gold Bullion ETF (ASX: NUGG) offers exposure to Australian-sourced gold. It also aids in portfolio risk management, especially during times of market volatility or when confidence in global reserve currencies diminishes. NUGG is backed by physical Australian-sourced gold bullion, providing a tangible asset. The units can be converted into physical gold, redeemable at an Australian vault.
While the ETF offers a unique exposure to premium Australian gold, it comes with several risks, including gold pricing, currency, custody, liquidity, and operational risks.
As of 31 January 2025, the fund’s performance history (%) is as follows:
NUGG Technical Summary and Chart
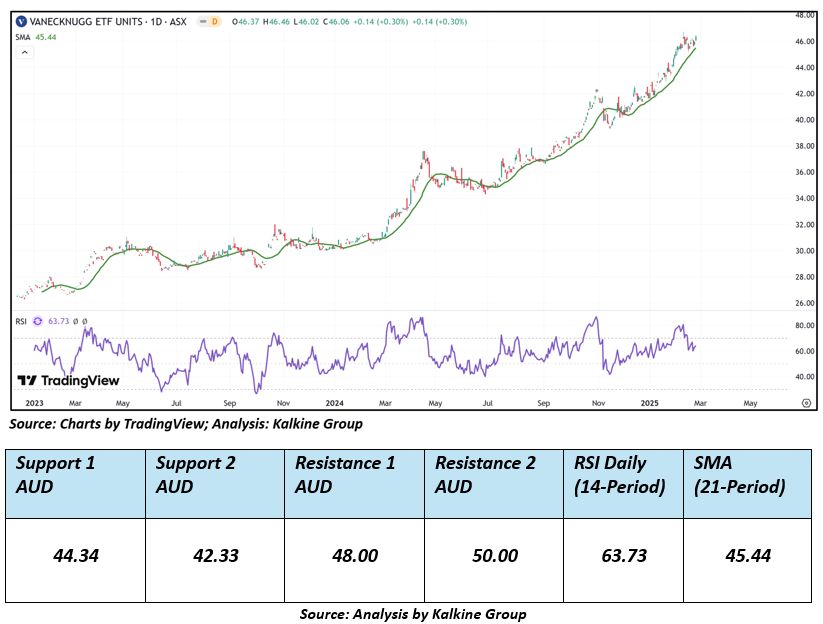
On the daily chart, NUGG's ETF prices are undergoing an uptrend characterised by higher highs and higher lows, indicating a positive bias. Additionally, the 14-period Relative Strength Index (RSI) is trading above its midpoint, reinforcing the likelihood of this scenario. Prices are trading above both trend-following indicators 21-period and 50-period SMAs, which might serve as dynamic support levels for the ETF; in contrast, the ETF’s next round levels may act as sentimental resistances. A significant support level for the ETF is positioned at AUD 42.33, while critical resistance level is situated at AUD 50.00.
To wrap up, the VanEck Gold Bullion ETF provides exposure to physical Australian gold, offering a tangible asset. While it has provided a 45% return over the past year, the fund is subject to risks such as fluctuations in gold pricing, liquidity, and operational factors.
However, it's important to remember that past performance is not a reliable indicator of future results. When selecting an ETF, it's essential to consider individual sector preferences, risk tolerance, and the specific performance of the underlying index.
Technical Indicators Defined: -
Support: A level at which the stock prices tend to find support if they are falling, and a downtrend may take a pause backed by demand or buying interest. Support 1 refers to the nearby support level for the stock and if the price breaches the level, then Support 2 may act as the crucial support level for the stock.
Resistance: A level at which the stock prices tend to find resistance when they are rising, and an uptrend may take a pause due to profit booking or selling interest. Resistance 1 refers to the nearby resistance level for the stock and if the price surpasses the level, then Resistance 2 may act as the crucial resistance level for the stock.
Abbreviations
CMP: Current Market Price
SMA: Simple Moving Average
AUD: Australian Dollar
RSI: Relative Strength Index


_12_18_2025_13_13_17_985559.png)

 Please wait processing your request...