_07_29_2025_10_31_01_336780.jpg)
Image source: © 2025 Krish Capital Pty.Ltd
Highlights
- GraniteShares YieldBOOST ETFs use options on leveraged ETFs to generate weekly returns, without holding the underlying stocks directly.
- YSPY targets income by selling puts on SPXL, offering indirect exposure to the S&P 500 with downside protection.
- TSYY uses options on 2x leveraged Tesla ETFs to seek yield while capping upside and limiting downside.
- NVYY sells puts on 2x leveraged NVDA ETFs and aims to balance income generation with risk mitigation.
The GraniteShares YieldBOOST ETF series offers exposure to high-profile equities—S&P 500 (via SPXL), Tesla, and NVIDIA, through income-focused options strategies. Rather than holding the underlying stocks or indices directly, these funds use put writing and protective put spreads on leveraged ETFs to target weekly returns while limiting downside risk. Each fund has a primary objective of generating current income, with secondary exposure to the performance of leveraged counterparts.
GraniteShares YieldBOOST SPY ETF (YSPY)
The GraniteShares YieldBOOST SPY ETF (YSPY) seeks to generate yield through options strategies tied to the S&P 500 index (SPY). It sells puts on leveraged S&P 500 ETFs and buys puts to help limit downside risk. The fund targets weekly income distributions.
YSPY doesn’t invest directly in SPY. Instead, it sells puts on SPXL (a 3x leveraged SPY ETF) and buys protective put spreads to limit losses. The fund’s primary objective is to seek current income. The Fund’s secondary objective is to seek exposure to the performance of the Direxion Daily S&P500® Bull 3X Shares (NYSE ARCA: SPXL) subject to a limit on potential investment gains.
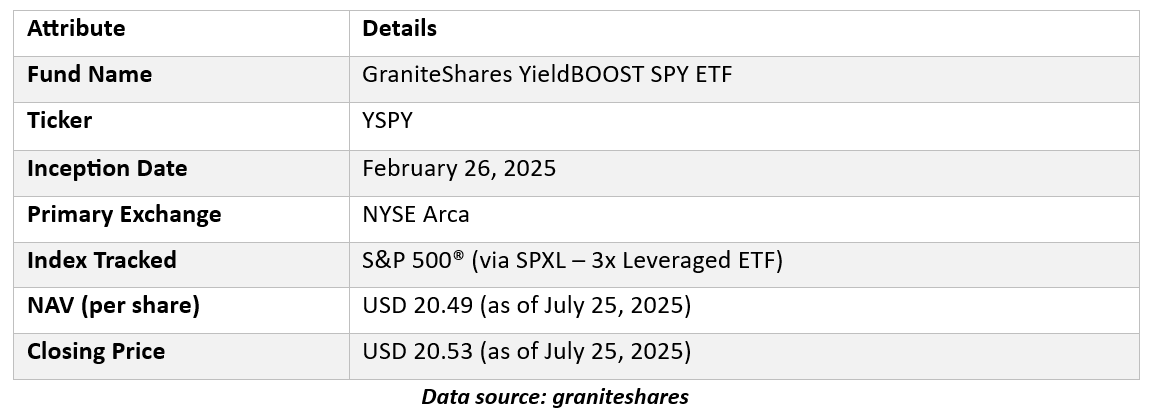
As of June 30, 2025, YSPY delivered a 1-month return of 7.45% (market price) and 7.13% (NAV), outperforming its benchmark’s 5.14% gain.
Technical Snapshot
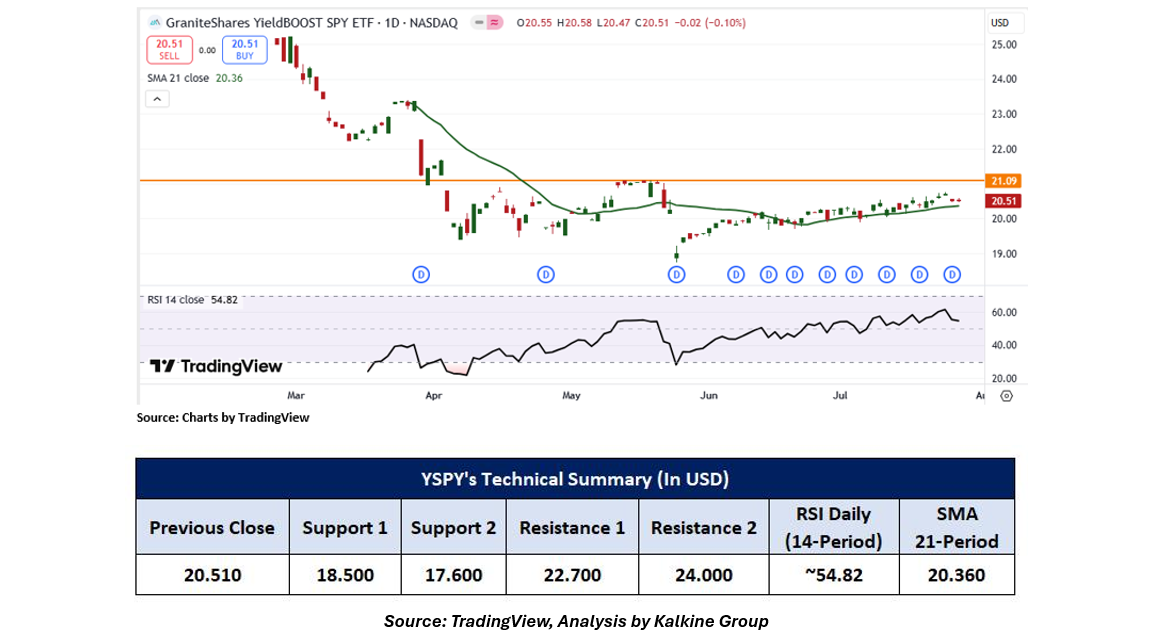
On the daily chart, the GraniteShares YieldBOOST SPY ETF is showing signs of cautious consolidation as it trades just below a key horizontal trendline resistance zone. This resistance area has capped upward momentum in recent sessions, suggesting that sellers are active near this level. The repeated failure to break above this zone indicates it is a critical supply area, and a decisive breakout would be needed to shift the short-term bias more clearly in favor of the bulls. Price action is currently struggling to push through the overhead trendline resistance, which adds technical weight to the existing ceiling. Until this level is breached, any upward moves may face selling pressure, keeping price action range-bound or slightly corrective. From a momentum perspective, the Relative Strength Index (RSI – 14 period) is currently reading at approximately 54.82. This level is moderately bullish and suggests that there is still some upward momentum in play, but not enough strength yet to confirm a breakout. RSI values above 50 typically support a bullish bias, although the reading near 55 shows momentum is not yet strong enough to overcome resistance levels decisively. On a more constructive note, the ETF's price is trading above its 21-period Simple Moving Average (SMA) a widely followed trend-following indicator. This reinforces a short-term bullish trend and suggests that the 21-SMA may now act as a dynamic support zone, providing a cushion for price pullbacks. If the price continues to hold above this moving average, it may encourage dip-buying behavior among traders.
GraniteShares YieldBOOST TSLA ETF (TSYY)
The GraniteShares YieldBOOST TSLA ETF (TSYY) seeks to generate income through options strategies linked to Tesla (TSLA). It sells puts on leveraged TSLA ETFs and buys puts for downside risk mitigation. The fund targets weekly income distributions.
TSYY does not directly hold Tesla stock. Instead, it uses options on leveraged ETFs that track 2x the daily performance of TSLA. The primary objective is current income, while the secondary objective is exposure to TSLA with capped upside.
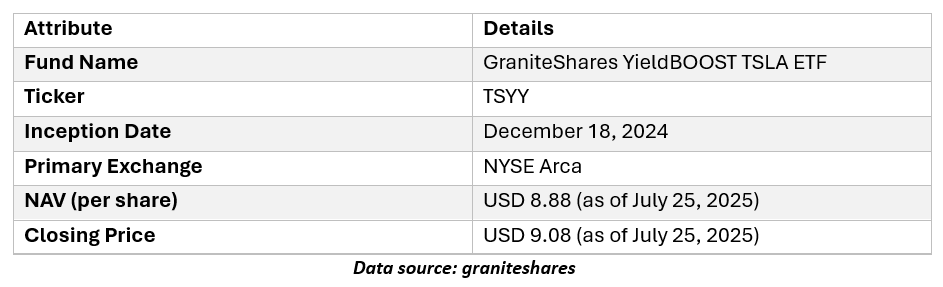
As of June 30, 2025, TSYY posted a 1-month return of –4.63% (market) and –4.45% (NAV), outperforming its benchmark's –8.31%. Over 3 months, the ETF lagged the benchmark with a 5.18% market return versus 22.57%.
Technical Snapshot
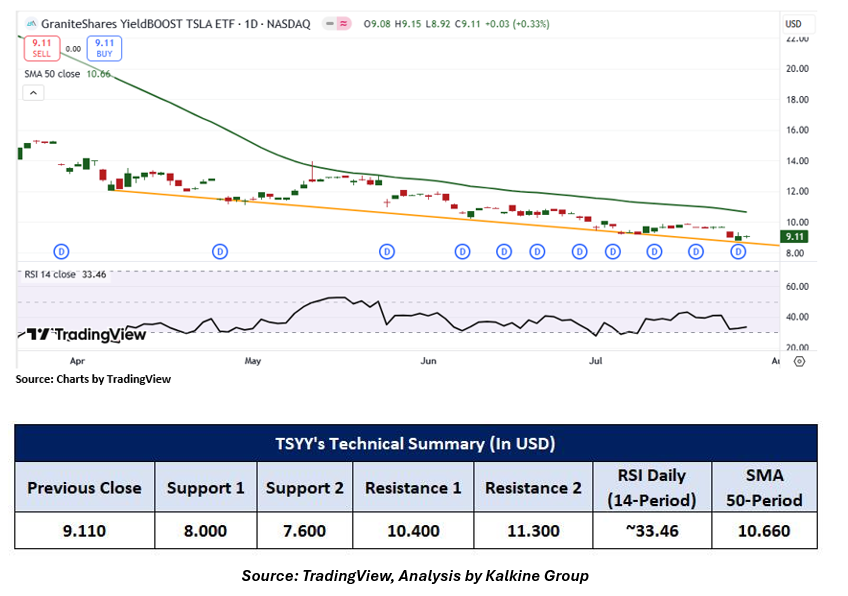
On the daily chart, the GraniteShares YieldBoost TSLA ETF is currently showing signs of technical stabilization after a recent period of weakness. Notably, the price action remains above a rising trendline support zone, which has been respected over the past few weeks. This trendline has acted as a dynamic area of buying interest, suggesting that bullish participants are still defending the lower levels. From a momentum perspective, the Relative Strength Index (RSI – 14 period) is currently reading around 33.46, having recently rebounded from the oversold territory (typically below 30). This recovery in RSI may indicate that bearish momentum is beginning to wane, potentially paving the way for a consolidation phase or a short-term relief bounce. However, despite these early signs of stabilization, the ETF's price remains below the 50-period Simple Moving Average (SMA), a key trend-following indicator. The 21-SMA has historically acted as a dynamic resistance level in short- to medium-term downtrends. Unless the price breaks decisively above this moving average, the broader bearish bias may remain intact. Additionally, volume analysis could be watched closely to confirm any upside attempts. A break above the 50-SMA, accompanied by increasing volume and further RSI recovery, could signal a shift in short-term sentiment from bearish to neutral or even mildly bullish.
GraniteShares YieldBOOST NVDA ETF (NVYY)
The GraniteShares YieldBOOST NVDA ETF (NVYY) seeks to provide income through options strategies tied to the performance of 2x leveraged ETFs tracking NVIDIA (NVDA). It generates yield by selling puts on leveraged NVDA ETFs and uses protective puts to help manage downside risk.
The primary objective is to generate current income, and the secondary objective is to provide limited exposure to the daily leveraged performance of NVDA.
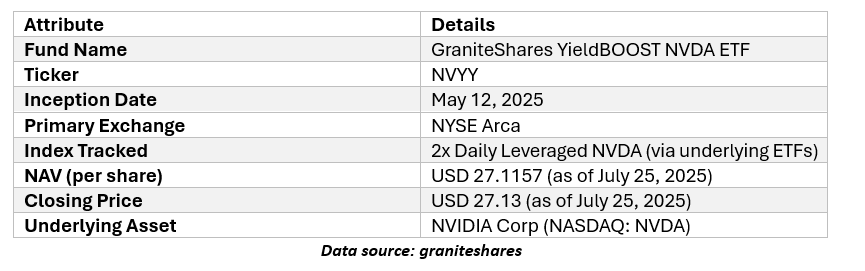 As of June 30, 2025, NVYY delivered a 1-month return of 12.28% (market) and 11.89% (NAV), underperforming its benchmark return of 16.93%.
Technical Snapshot
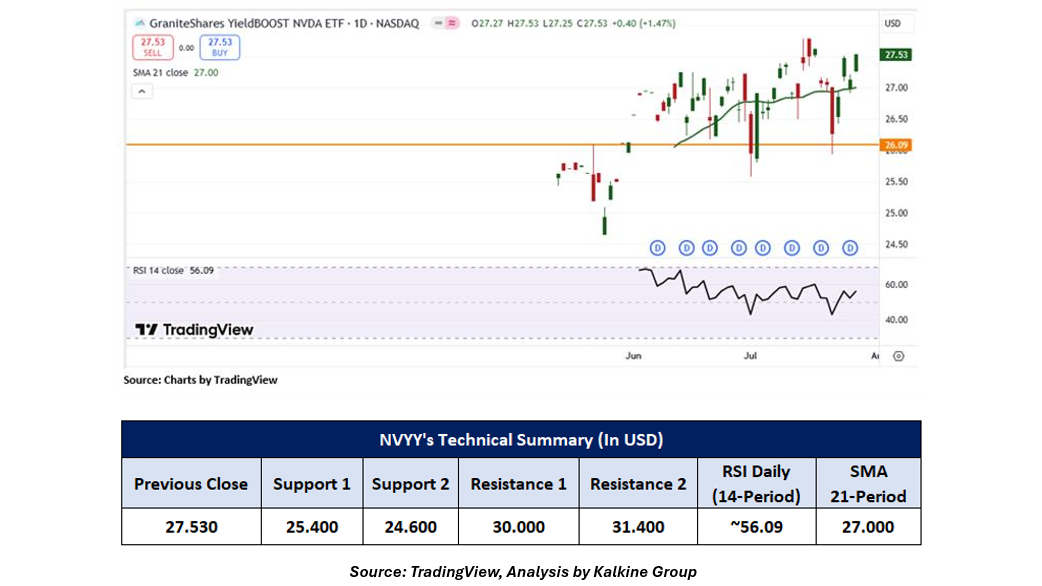
On the daily chart, the GraniteShares YieldBoost NVDA ETF is exhibiting a constructive technical setup, suggesting underlying bullish momentum. The ETF's price is currently trading above a key horizontal trendline support level, which has been tested multiple times in the recent past and has held firmly. This level represents a critical area where buyers have consistently stepped in, reinforcing its role as a strong base of support. From a momentum standpoint, the 14-period Relative Strength Index (RSI) is currently reading around 56.09, which lies in neutral-to-bullish territory. This level indicates that the ETF is gaining strength but has not yet entered overbought conditions. The RSI above 50 often reflects a shift toward positive price momentum, suggesting that the bulls may be gaining control of the short-term trend. Moreover, prices are currently trading above the 21-period Simple Moving Average (SMA) a widely watched trend-following indicator that often acts as dynamic support or resistance. The fact that NVDY is holding above this moving average reinforces the bullish bias, as it reflects that the short-term trend is upward. This 21-SMA may now serve as an immediate support zone, and a bounce from this level could trigger fresh buying interest. Additionally, the confluence of the horizontal support and 21-SMA support strengthens the overall technical base for the ETF. If the price remains above these levels, it could pave the way for a potential continuation of the upward move, especially if accompanied by an uptick in volume and sustained RSI improvement.
It's important to remember that past performance is not a reliable indicator of future results. When selecting an ETF, it's essential to consider individual sector preferences, risk tolerance, and the specific performance of the underlying index.
Technical Indicators Defined: -
Support: A level at which the ETF prices tend to find support if they are falling, and a downtrend may take a pause, backed by demand or buying interest. Support 1 refers to the nearby support level for the ETF and if the price breaches the level, then Support 2 may act as the crucial support level for the ETF.
Resistance: A level at which the ETF prices tend to find resistance when they are rising, and an uptrend may pause due to profit booking or selling interest. Resistance 1 refers to the nearby resistance level for the ETF, and if the price surpasses the level, then Resistance 2 may act as the crucial resistance level for the ETF.
Abbreviations
CMP: Current Market Price
SMA: Simple Moving Average
RSI: Relative Strength Index
USD: United States Dollar


_12_18_2025_13_13_17_985559.png)

 Please wait processing your request...