
Image source: Shutterstock
Highlights
- In H1FY25, revenue of CEN increased by 30.7% YoY to NZD 1,707 million
- Comprehensive income in H1 FY25 jumps nearly 5x to NZD 137 million
- Interim dividend increased to 16 cps, up 14% YoY from H1 FY 2024
Contact Energy Limited (NZX:CEN) is a major New Zealand-based energy generator and retailer operating across Wholesale and Retail segments. In the six months ended 31 December 2024 (H1FY25), the company reported revenue of NZD 1,707 million, marking a 30.7% YoY increase from NZD 1,306 million in H1 FY24. This growth translated to an NZD 401 million YoY increase. Comprehensive income also saw a significant uplift, rising to NZD 137 million from NZD 28 million in the prior corresponding period.
However, profit after tax stood at NZD 142 million, slightly down from NZD 153 million in H1FY24.
The operating result was driven by surge in geothermal generation with the Tauhara plant coming online, elevated Contracts for Difference (CFDs) and improved channel pricing from the initiation of long-term contracts. A notable contributor was the commencement of Contact’s new supply agreement with the New Zealand Aluminium Smelter (NZAS), effective from 1 July 2024.
Dividend Growth
The Board of CEN declared an interim dividend of 16 cps, up 2 cps or 14% from the 14 cps declared in H1FY24.
Recent Business Updates
In its April operating report, Contact highlighted that in March 2025, its customer segment recorded mass market electricity and gas sales of 282 GWh. This was a slight dip from 297 GWh in March 2024. However, the mass market netback surged to $182.13/MWh, significantly higher than the $142.10/MWh recorded in the same month last year, indicating enhanced profitability per unit.
Share performance of CEN
CEN shares closed 0.22% higher at NZD 9.30 on 14 April 2025. Over the past year, CEN’s share price has gained approximately 6.25%, although it has declined by 5.16% year-to-date. The stock reached its 52-week high of NZD 9.80 on 30 December 2024 and its 52-week low of NZD 7.86 on 23 September 2024.
Resistance and support summary
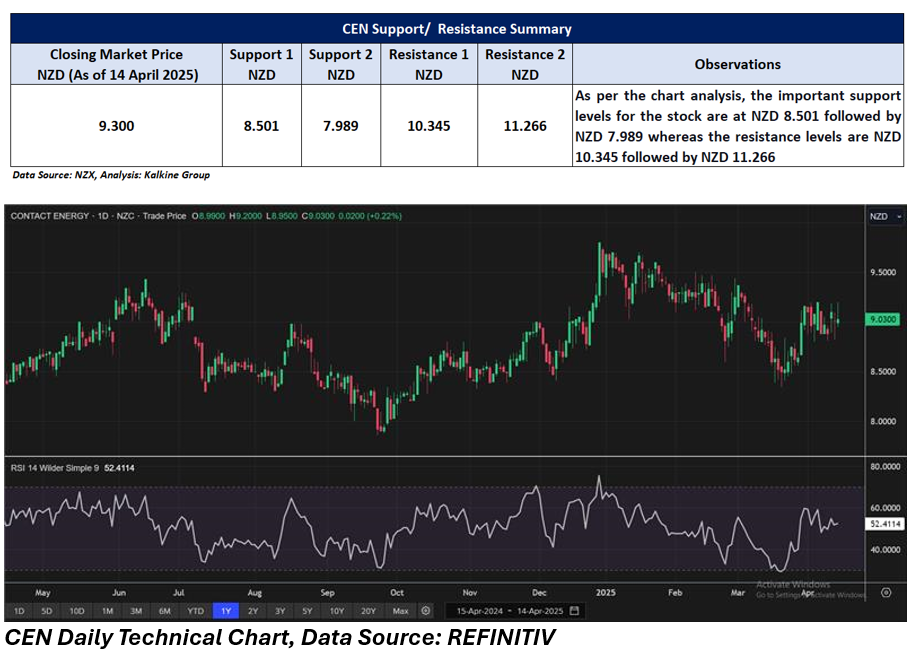
Note 1: Past performance is not a reliable indicator of future performance.
Note 2: The reference date for all price data, currency, technical indicators, support, and resistance levels is 14 April 2025. The reference data in this report has been partly sourced from EODHD/Others.
Technical Indicators Defined:
Support: A level at which the stock prices tend to find support if they are falling, and a downtrend may take a pause backed by demand or buying interest. Support 1 refers to the nearby support level for the stock and if the price breaches the level, then Support 2 may act as the crucial support level for the stock.
Resistance: A level at which the stock prices tend to find resistance when they are rising, and an uptrend may take a pause due to profit booking or selling interest. Resistance 1 refers to the nearby resistance level for the stock and if the price surpasses the level, then Resistance 2 may act as the crucial resistance level for the stock.


_12_18_2025_13_13_17_985559.png)

 Please wait processing your request...