
Image source: Shutterstock
Highlights
- AFT’s FY25 revenue increased by 6% from NZD 186.9 million in FY24 to NZD 207.4 million.
- In FY25, the company declared a final dividend of 1.8 cents per share.
- AFT targets NZD 300 million in revenue by FY27 and NZD 20 - 24 million in operating profit in FY26.
AFT Pharmaceuticals Limited (NZX:AFT) is a New Zealand-based multinational pharmaceutical company that primarily deals in a diverse range of proprietary and in-licensed medicines.
In the financial year 2025 (FY25), the company reported a 6.45% YoY increase in its revenue, reaching NZD 208.0 million, driven by an 11% rise in product sales and royalties across all markets, along with NZD 0.7 million in licensing income. Australian sales climbed 17% YoY in FY25, although this growth was partially offset by one-off impacts such as destocking and temporary disruptions in demand for Maxigesic IV during the first half of FY25.
Despite the top-line growth, earnings were lower, with EBITDA down 20% YoY to NZD 20.9 million and operating profit falling 27% YoY to NZD 17.6 million, both in line with guidance issued at the half-year. Meanwhile, net profit after tax declined 23% to NZD 12.0 million.
The company declared a final dividend of 1.8 cents per share for FY25, up from 1.6 cps in FY24.
Recent Business Update
On 26 May 2025, AFT announced the extension of its U.S. Maxigesic® licensing agreement with Hikma Pharmaceuticals. The expanded deal enables Hikma to distribute Combogesic Rapid across all U.S. channels, excluding specific markets licensed to Alexso, enhancing access to AFT’s pain relief products in the world’s largest market.
Company Outlook
AFT Pharmaceuticals maintains a confident outlook for FY26, aiming to build on its growth momentum as it targets NZD 300 million in revenue by FY27. The company expects operating profit to range between NZD 20 million and NZD 24 million in FY26, supported by a pipeline of new products in Australasia, expanding international operations, and growing geographic and product diversification. Despite global market headwinds, AFT remains focused on addressing unmet clinical needs through strategic in-licensing, development, and commercialisation, positioning itself for sustained long-term growth.
Share performance of AFT
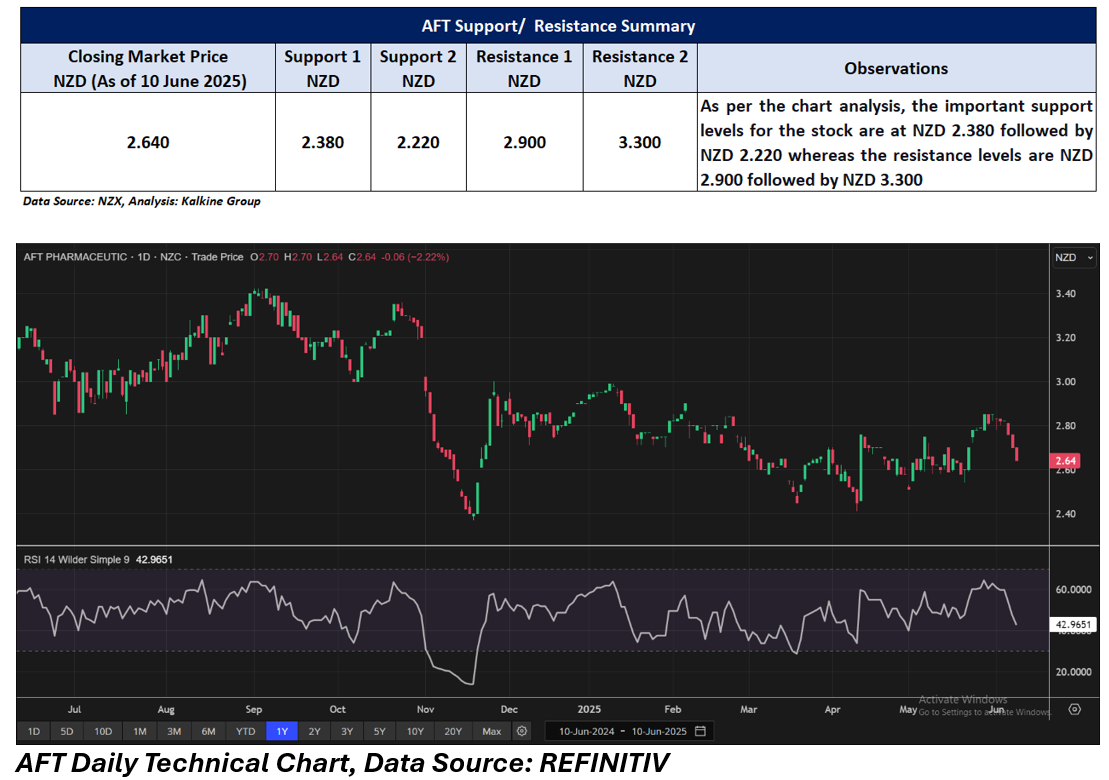
AFT Pharmaceuticals closed at NZD 2.64 on 10 June 2025, down 2.22% intraday. Over the past week, the stock fell 6.71% and posted a modest 0.76% gain over the last month. The stock is down 7.37% over six months, 19.02% over nine months, and 17.50% over the past year.
52-week high of AFT is NZD 3.42, recorded on 5 September 2024 and 52-week low is NZD 2.37, recorded on 19 November 2024.
Resistance and support summary
Note 1: Past performance is not a reliable indicator of future performance.
Note 2: The reference date for all price data, currency, technical indicators, support, and resistance levels is 10 June 2025. The reference data in this report has been partly sourced from EODHD/Others.
Technical Indicators Defined:
Support: A level at which the stock prices tend to find support if they are falling, and a downtrend may take a pause backed by demand or buying interest. Support 1 refers to the nearby support level for the stock and if the price breaches the level, then Support 2 may act as the crucial support level for the stock.
Resistance: A level at which the stock prices tend to find resistance when they are rising, and an uptrend may take a pause due to profit booking or selling interest. Resistance 1 refers to the nearby resistance level for the stock and if the price surpasses the level, then Resistance 2 may act as the crucial resistance level for the stock.


_12_18_2025_13_13_17_985559.png)

_11_27_2025_13_17_04_571639.png)
 Please wait processing your request...