_10_30_2025_06_13_43_857432.jpg)
Highlights
- NVDY has delivered an annualized return of 75.06% since inception.
- Since launch, NVDY has recorded a cumulative return of 281.61% (NAV basis).
- Weekly cash flow strategy leverages call options on NVDA to capture consistent option premiums.
- While offering high cash distributions, the fund carries single-issuer and capped upside risks due to its NVDA-focused exposure.
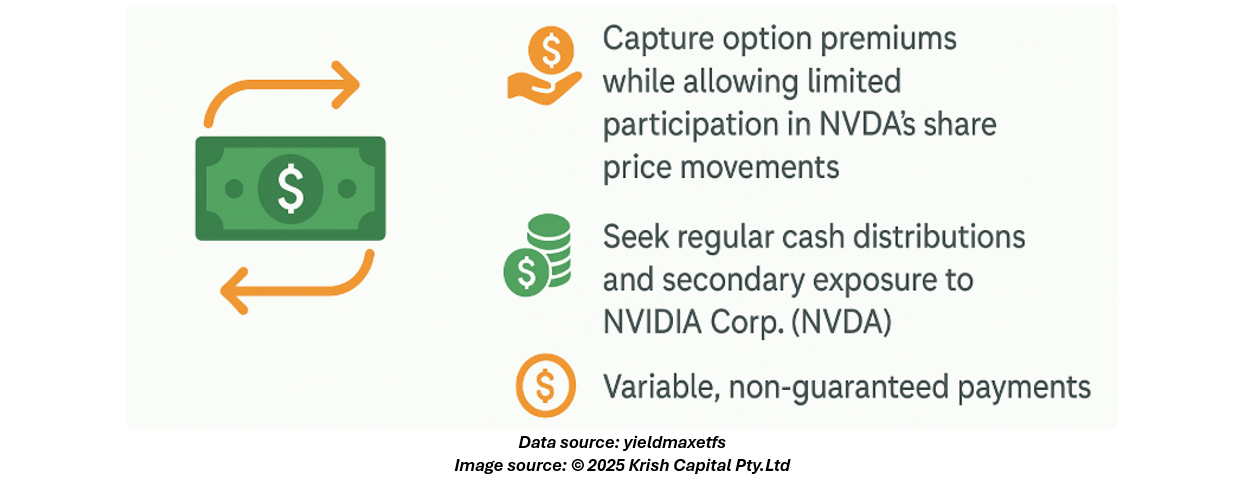
The YieldMax® NVDA Option Strategy ETF (NVDY) is an actively managed exchange-traded fund that seeks to generate weekly cash flow through the sale of call options or call spreads on NVDA. The approach aims to capture option premiums while allowing limited participation in NVDA’s share price movements. The Fund’s primary objective is to produce regular cash distributions, with a secondary objective of providing exposure to the share price of NVIDIA Corp. (NVDA).
Fund Information
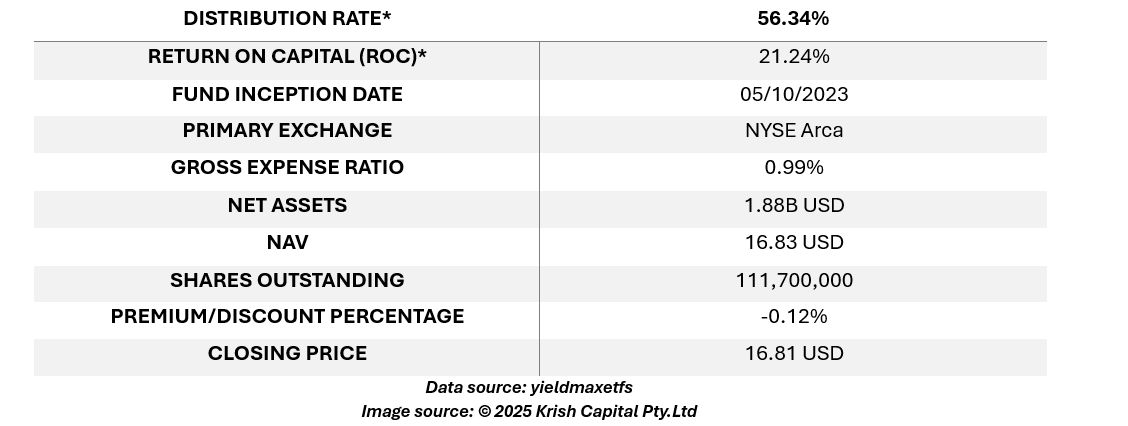
* The most recent distribution on 10/29/2025 contains 21.24% return of capital and 78.76% income.
Fund Performance
As of September 30, 2025, the fund’s market performance shows a 1-month return of 4.89%, a 3-month return of 15.96%, a 6-month return of 52.99%, year-to-date 24.86%, and 1-year 38.48%.
Since inception (May 10, 2023), the cumulative return is 276.86% and the annualized return is 74.14%. NAV results are: 1-month 4.88%, 3-month 15.93%, 6-month 53.29%, year-to-date 25.28%, 1-year 38.86%, cumulative 281.61%, and annualized 75.06%.
Technical Snapshot
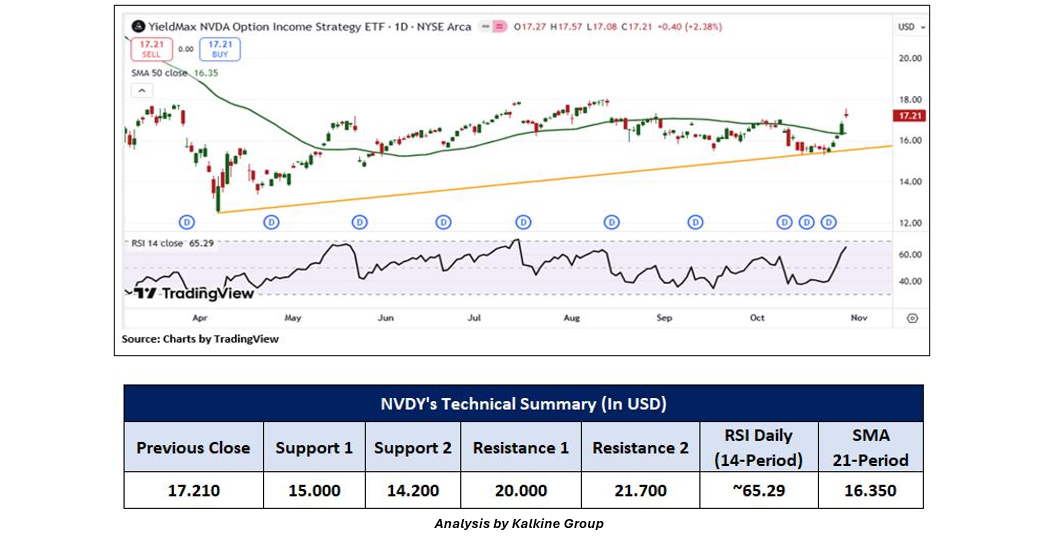
On the daily chart, NVDY prices remain firmly above a rising trendline support zone, underscoring a sustained and well-established uptrend. This trendline has been validated through multiple successful tests, reinforcing its role as a key structural support level. Continued price action above this area indicates persistent buying interest and strong market confidence, with demand consistently absorbing any pullbacks. Bullish momentum is further confirmed by technical indicators: the 14-period Relative Strength Index (RSI) currently sits at 65.29, recovering from recent lows and approaching the overbought threshold. This rebound points to growing bullish momentum and increased buyer participation. Additionally, NVDY is trading above the 21-period Simple Moving Average (SMA), which serves as dynamic support in alignment with the prevailing trend. The upward slope of the SMA highlights a positive short-term outlook, suggesting that while prices hold above this level, the near-term bias remains decisively bullish.
Key Risk Information
The Fund involves a high degree of risk and may not be suitable for all individuals. The Fund does not invest directly in NVDA but is exposed to the performance of NVDA shares through its strategy. This creates single issuer risk, as the Fund’s value may fluctuate more sharply than that of a diversified investment. The strategy also limits potential gains if NVDA shares rise, while exposing individuals to full downside risk if NVDA shares decline. Any income generated by the fund may not offset these potential losses.
It's important to remember that past performance is not a reliable indicator of future results. When selecting an ETF, it's essential to consider individual sector preferences, risk tolerance, and the specific performance of the underlying index.
Technical Indicators Defined: -
Support: A level at which the ETF prices tend to find support if they are falling, and a downtrend may take a pause, backed by demand or buying interest. Support 1 refers to the nearby support level for the ETF and if the price breaches the level, then Support 2 may act as the crucial support level for the ETF.
Resistance: A level at which the ETF prices tend to find resistance when they are rising, and an uptrend may pause due to profit booking or selling interest. Resistance 1 refers to the nearby resistance level for the ETF, and if the price surpasses the level, then Resistance 2 may act as the crucial resistance level for the ETF.
Abbreviations
CMP: Current Market Price
SMA: Simple Moving Average
RSI: Relative Strength Index
USD: United States Dollar


_12_18_2025_13_13_17_985559.png)

 Please wait processing your request...