
Highlights
- FY25 revenue of STU dropped to NZD 385.4 million, reflecting decrease in demand and pricing pressure.
- The company reported a net loss after tax of NZD 24.4 million, compared to a profit of NZD 2.6 million in FY24.
- Steel & Tube maintained a current ratio of 2.33x, above the industry median of 1.74x.
Steel & Tube Holdings Limited (NZX:STU) is a steel solutions provider in New Zealand, offers a broad selection of products through its network of distribution centres across the country.
Financial Performance
In the financial year 2025 (FY25), STU has recorded total revenue of NZD 385.4 million, compared with NZD 479.1 million in the previous year. Meanwhile, net loss after tax reached to NZD 24.4 million, compared to NPAT of NZD 2.6 million in previous corresponding period. Net operating cashflow for the period stood at NZD 10.4 million, compared to NZD 42.2 million in FY24.
The difficult economic conditions in FY25 impacted steel demand, leading to lower volumes and a reduced average selling price. Sales revenue declined 20% to NZD 385.4 million, reflecting a 12% fall in volumes combined with product mix changes and pricing pressure.
Daily volumes and sales showed improvement in the second half of FY25, albeit from a low starting point. The combined effects of reduced volumes and pricing contributed to a decline in full-year earnings.
Key Positives and Negatives
The current ratio was 2.33x in FY 2025, compared with the industry median of 1.74x. Other operating income reached NZD 0.44 million in FY 2025, up from NZD 0.058 million in FY 2024. Operating expenses stood at NZD 94.5 million in FY 2025, compared with NZD 93.5 million in FY 2024.
Business Outlook
In FY26, the economic conditions are expected to improve, potentially enhancing market activity, though the timing and pace of recovery remain unclear.
Share performance
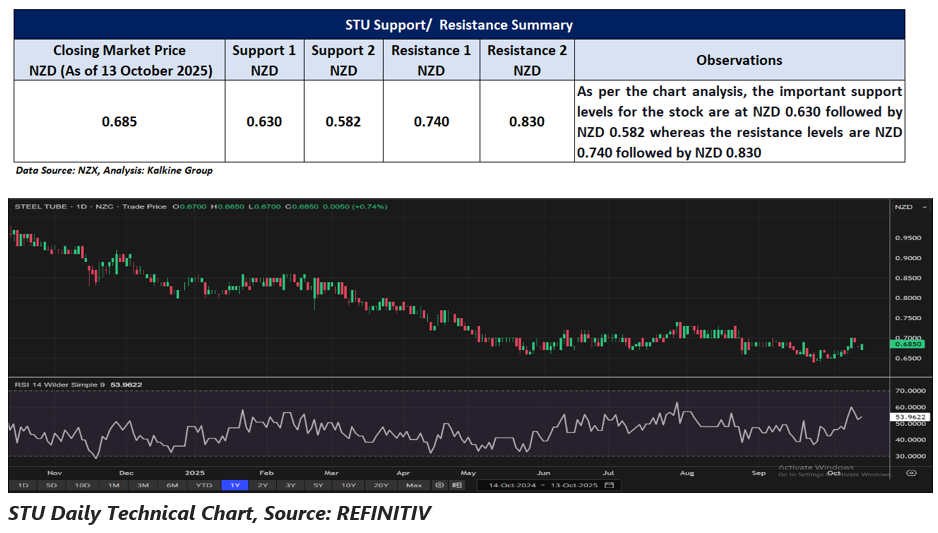
On 13 October 2025, the company’s shares were trading at NZD 0.6850 per share, with an intraday gain of 0.74%. Over the past three months, the stock declined by 0.724%, and it was down 6.16% over the last six months. In the past year, the share price fell by 30.10%. The 52-week high of NZD 0.9800 was recorded on 14 October 2024, while the 52-week low of NZD 0.6400 was recorded on 25 September 2025.
Support and Resistance Summary
Note 1: Past performance is neither an Indicator nor a guarantee of future performance.
Note 2: The reference date for all price data, and currency, is 13 October 2025. The reference data in this report has been partly sourced from EODHD/Others.
Technical Indicators Defined:
Support: A level at which the stock prices tend to find support if they are falling, and a downtrend may take a pause backed by demand or buying interest. Support 1 refers to the nearby support level for the stock and if the price breaches the level, then Support 2 may act as the crucial support level for the stock.
Resistance: A level at which the stock prices tend to find resistance when they are rising, and an uptrend may take a pause due to profit booking or selling interest. Resistance 1 refers to the nearby resistance level for the stock and if the price surpasses the level, then Resistance 2 may act as the crucial resistance level for the stock.


_12_18_2025_13_13_17_985559.png)

 Please wait processing your request...