_10_21_2025_10_29_55_612843.png)
Highlights
- Solution Dynamics reported FY25 revenue of NZD 40.9 million, up 6.97% from FY24.
- EBITDA in FY25 declined 8% YoY to NZD 4.45 million, with EBITDA margin falling to 10.8%.
- Liquidity improved, with current and quick ratios rising to 2.40x and 2.35x, respectively, in FY25.
Solution Dynamics Limited (NZX:SDL), a New Zealand-based provider of customer communication solutions, reported revenue growth for the financial year ended 30 June 2025 (FY25). The company achieved NZD 40.9 million in revenue, marking a 6.97% increase from NZD 38.25 million in FY24. The increase was partially attributed to a pass-through of higher postage costs, though these carried minimal margins.
During the second half of the year, SDL’s largest customer experienced a decline in business activity, resulting in a 15% drop in revenue contribution from that client for the full year.
EBITDA for FY25 stood at NZD 4.45 million, compared to NZD 4.83 million in the prior year, representing an 8% decline. The EBITDA margin decreased to 10.8% from 12.5% in FY24, while the net margin contracted to 6.3% from 7.3% in the previous year.
Liquidity and Balance Sheet Metrics
The current ratio increased to 2.40x from 2.09x in FY24, while the quick ratio rose to 2.35x from 2.04x a year earlier.
Outlook
Looking ahead, Solution Dynamics is investing in technology development and integrating artificial intelligence-enabled features aimed at improving client outcomes.
Share performance of SDL
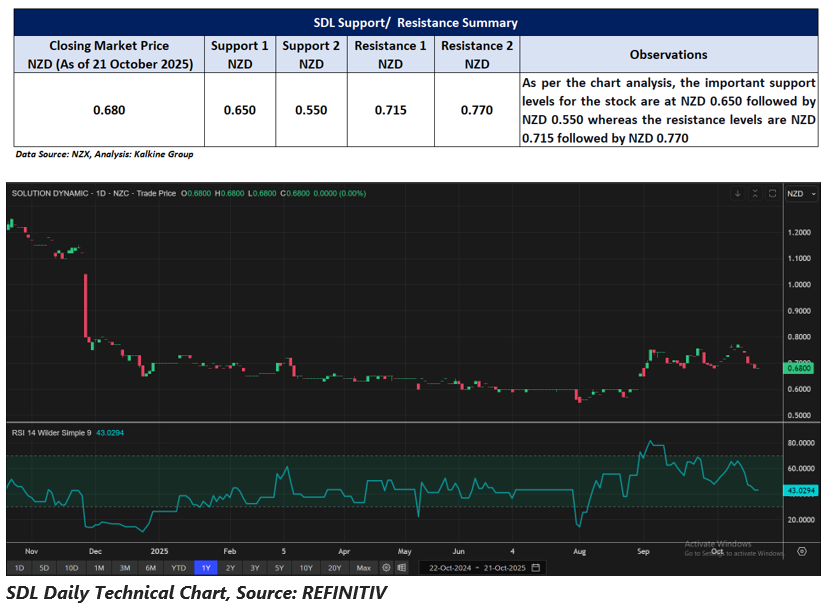
SDL shares remained unchanged at NZD 0.6800 per share on 21 October 2025. Over the past year, SDL’s stock has declined 43.33%. The share price fell 10.53% over the past week and 6.85% over the past month. Over the past three months, however, SDL gained 13.33%, and it rose 6.25% over the past six months.
The 52-week high for SDL is NZD 1.2500, while the 52-week low is NZD 0.5500.
Support and Resistance Summary
Note 1: Past performance is neither an Indicator nor a guarantee of future performance.
Note 2: The reference date for all price data, and currency, is 21 October 2025. The reference data in this report has been partly sourced from EODHD/Others.
Technical Indicators Defined:
Support: A level at which the stock prices tend to find support if they are falling, and a downtrend may take a pause backed by demand or buying interest. Support 1 refers to the nearby support level for the stock and if the price breaches the level, then Support 2 may act as the crucial support level for the stock.
Resistance: A level at which the stock prices tend to find resistance when they are rising, and an uptrend may take a pause due to profit booking or selling interest. Resistance 1 refers to the nearby resistance level for the stock and if the price surpasses the level, then Resistance 2 may act as the crucial resistance level for the stock.


_12_18_2025_13_13_17_985559.png)

 Please wait processing your request...