_08_20_2025_11_26_45_126341.png)
Image source: © 2025 Krish Capital Pty. Ltd.
Highlights
- Ryman Healthcare reported 337 ORA sales in Q1 FY26, down 11% YoY but rebounding 12% sequentially.
- FY25 operating revenue rose 12.1% to NZD 771.1m, with EBITDAF jumping to NZD 45.5m from NZD 14.8m in FY24.
- RYM’s debt-to-equity ratio improved to 0.40x in FY25, though net margin remained negative at -57.4%.
Ryman Healthcare Limited (NZX:RYM) is New Zealand’s largest provider of retirement living options and has reported a mixed start to the financial year 2026 (FY26).
In the first quarter of FY26 (Q1 FY26), Ryman recorded 337 sales of occupation right agreements (ORAs), comprising 73 new sales and 264 resales. While total sales were 11% below the prior-year quarter, resales fell just 5%, outperforming new sales which dropped 28%. Sequentially, sales rebounded 12% compared to Q4 FY25.
Encouragingly, gross contracts climbed to 91% of the two-year comparative average, showing a sharp recovery from 75% in Q4 FY25.
Looking ahead, the company’s FY26 ORA sales are tracking towards the upper end of guidance (1,100 – 1,300), compared with 1,523 sales in FY25.
FY25 Financial Snapshot
Ryman closed FY25 with operating revenue of NZD 771.1 million, up 12.14% YoY, while operating EBITDAF rose sharply to NZD 45.5 million from NZD 14.8 million in FY24. During the reported period, the company saw the highest-ever build rate of 950 units, with four main buildings and three new villages completed.
The company’s financial structure improved, with the debt-to-equity ratio falling to 0.40x in FY25 from 0.69x in FY24. Additionally, the EBITDA margin improved to 2.4%, reversing a negative 1.8% margin in the previous year.
However, in FY25, the company posted a negative net margin of -57.4% and a negative operating margin of -29.8%.
Share Performance of RYM
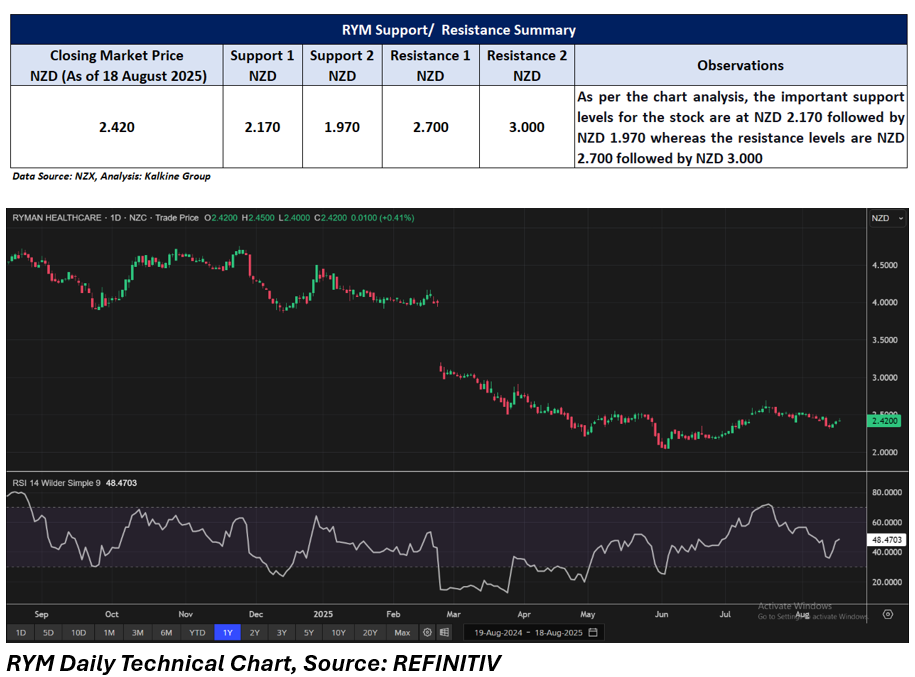
RYM shares inched up 0.41% to close at NZD 2.42 per share on 18 August 2025. In a year, RYM’s share price has declined 46.55% and is down 44.62% year-to-date. The stock eased 0.82% over the past week and 6.92% over one month, but gained 0.83% over three months. The 52-week high of NZD 4.75 was recorded on 25 November 2024, while the 52-week low of NZD 2.04 was reached on 4 June 2025.
Support and Resistance Summary
Note 1: Past performance is neither an Indicator nor a guarantee of future performance.
Note 2: The reference date for all price data, and currency, is 18 August 2025. The reference data in this report has been partly sourced from EODHD/Others.
Technical Indicators Defined:
Support: A level at which the stock prices tend to find support if they are falling, and a downtrend may take a pause backed by demand or buying interest. Support 1 refers to the nearby support level for the stock and if the price breaches the level, then Support 2 may act as the crucial support level for the stock.
Resistance: A level at which the stock prices tend to find resistance when they are rising, and an uptrend may take a pause due to profit booking or selling interest. Resistance 1 refers to the nearby resistance level for the stock and if the price surpasses the level, then Resistance 2 may act as the crucial resistance level for the stock.


_12_18_2025_13_13_17_985559.png)

 Please wait processing your request...