
Image source: © 2025 Krish Capital Pty. Ltd.
Highlights
- Briscoe Group delivered stable FY25 sales of NZD 791.5m, broadly unchanged from FY24.
- BGP’s Q2 FY26 sales rose 2.07% YoY to NZD 192.9m.
- The company expects NPAT of at least NZD 29m for H1 FY26, with profitability in H2 projected to surpass H1.
Briscoe Group Limited (NZX:BGP), a New Zealand-based non-trading holding company operating through its Homeware and Sporting Goods divisions, delivered stable sales in the financial year ended 26 January 2025 (FY25).
FY25 Performance
Briscoe Group posted total sales revenue of NZD 791.5 million, broadly unchanged from FY24’s NZD 792.0 million, reflecting a marginal decline of just 0.06%. Both Homeware and Sporting Goods segments contributed equally, with each delivering 99.94% of the prior year’s sales. Notably, three out of four trading quarters recorded positive sales growth.
However, gross profit declined 4.83% YoY to NZD 319.5 million, compared to NZD 335.8 million in FY24. This resulted in the gross margin percentage easing from 42.40% to 40.37%, primarily due to subdued consumer sentiment and inflationary pressures that impacted discretionary spending.
Recent Business Update
For the 13 weeks ended 27 July 2025 (Q2 FY26), Briscoe reported unaudited sales of NZD 192.9 million, representing a 2.07% increase on the NZD 189.0 million achieved in the prior comparable period.
Outlook
Looking ahead, the company expects NPAT of at least NZD 29 million for the first half (H1) of FY26. Management anticipates that profitability in the second half will exceed H1 performance.
Share performance of BGP
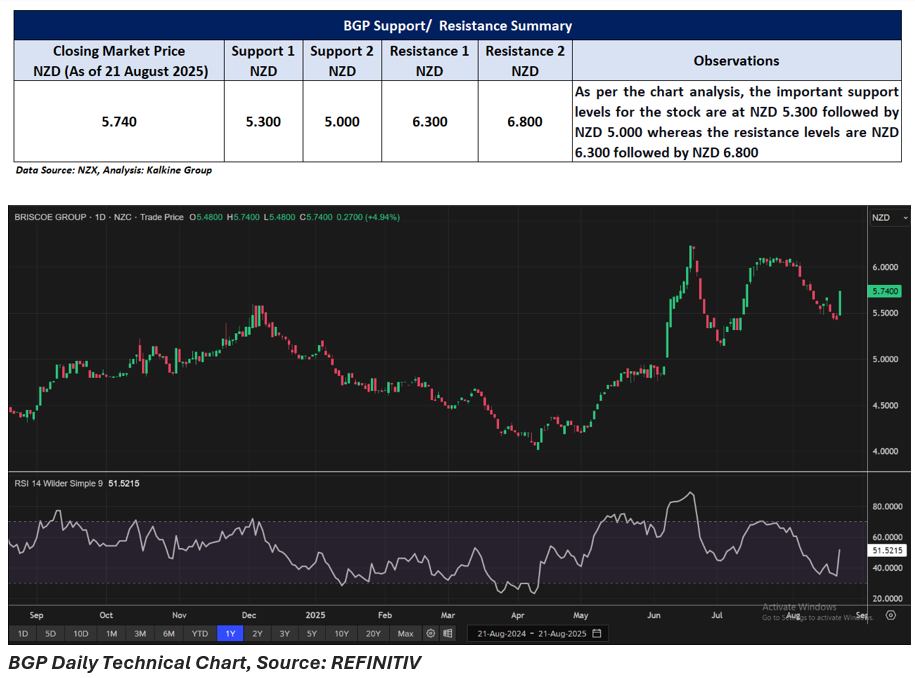
BGP shares increased 4.94% intraday to close at NZD 5.740 per share on 21 August 2025. The stock has gained 1.79% over the past week but declined 5.94% in one month. Over three months, BGP is up 17.04%, with a six-month gain of 20.00% and a nine-month rise of 10.47%. On a yearly basis, the stock has advanced 28.67%.
The 52-week high of NZD 6.230 was recorded on 18 June 2025, while the 52-week low of NZD 4.020 was touched on 9 April 2025.
Support and Resistance Summary
Note 1: Past performance is neither an Indicator nor a guarantee of future performance.
Note 2: The reference date for all price data, and currency, is 21 August 2025. The reference data in this report has been partly sourced from EODHD/Others.
Technical Indicators Defined:
Support: A level at which the stock prices tend to find support if they are falling, and a downtrend may take a pause backed by demand or buying interest. Support 1 refers to the nearby support level for the stock and if the price breaches the level, then Support 2 may act as the crucial support level for the stock.
Resistance: A level at which the stock prices tend to find resistance when they are rising, and an uptrend may take a pause due to profit booking or selling interest. Resistance 1 refers to the nearby resistance level for the stock and if the price surpasses the level, then Resistance 2 may act as the crucial resistance level for the stock.


_12_18_2025_13_13_17_985559.png)

 Please wait processing your request...