
Image Source : Krish Capital Pty Ltd
Index Update: On 5th March 2025, the broader NZ market ended in red after Wall Street closed lower amidst tensions related to the macro-economic uncertainties. On 4th March, NASDAQ Composite Index declined by 0.35% to 18,285.16. On 5th March, S&P/NZX 50 Index witnessed a decline of 0.46% to end at 12,412.070 and S&P/NZX 20 Index fell by 0.80% to close at 7,409.430. Also, S&P/NZX All Industrials declined by 2.02% to 2,240.040. However, S&P/NZX All Health Care rose by 1.66%.
Macro Update: As per FEU dated 21st February 2025, NZ’s merchandise trade continued rebalancing in early-2025. Notably, the annual goods trade deficit narrowed to $7.2 Bn in January, from $7.8 Bn in December. Export values, which increased by 11% in the month, were helped by the strong lifts in dairy and forestry exports. The lower exchange rate, increased commodity prices as well as robust domestic production would continue to support exports over early-2025.
Top Market Movers: Among top gainers, WasteCo Group Limited (NZX: WCO) increased by 8.33% to end at $0.026 per share. On the other hand, Move Logistics Group Ltd (NZX: MOV) declined by 8.70%.
Commodity Update: The U.S. dollar dropped to a three-month low against major currencies. At the same time, Asian shares showed mixed results after new U.S. tariffs prompted countermeasures from China and Canada, raising fears of an escalating trade war. In commodities, gold fell 0.13% to $2,917.80, silver rose 0.28% to $32.47, and copper increased by 0.20% to $9,384.80. Brent crude oil declined 0.20% to $70.93 amid concerns over global trade tensions and rising oil production. Oil prices hit a five-month low on Tuesday, with OPEC+ confirming plans to boost output from April amid ongoing economic uncertainties modestly.
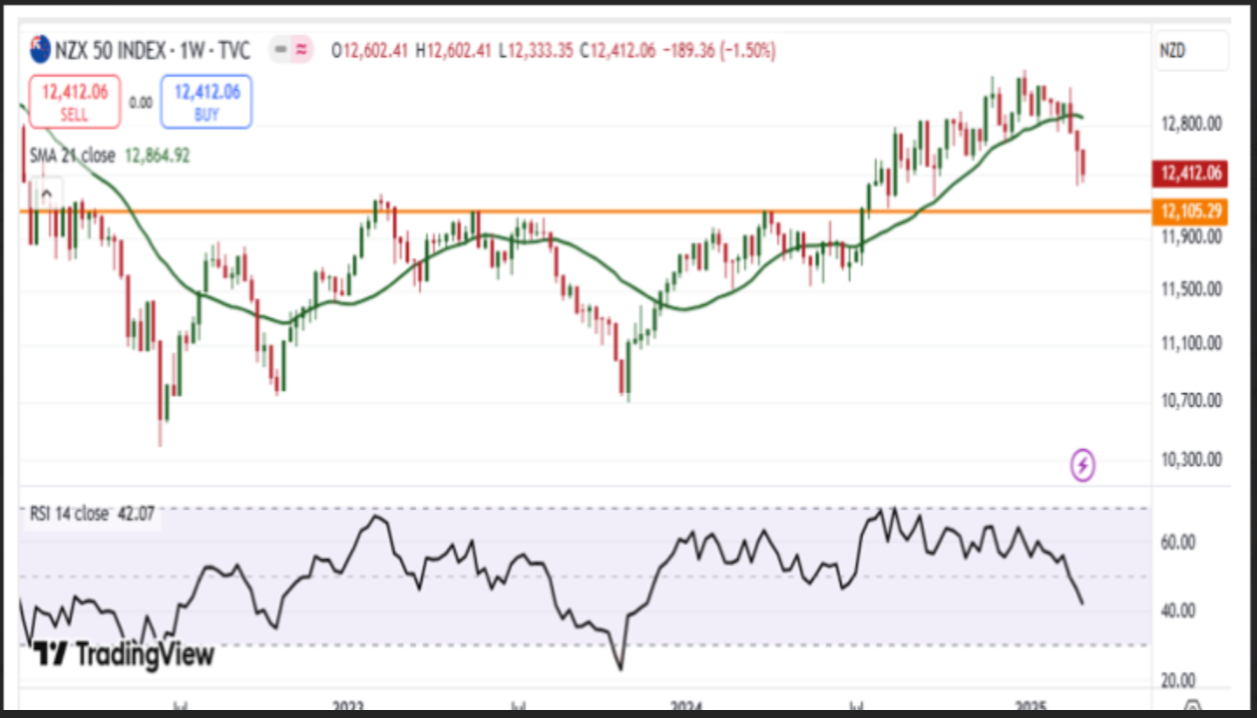
Source: Trading View, Analysis: Kalkine Group
The S&P/NZX 50 Index faced downward pressure, dropping 57.66 points, marking a significant move in the market. This decline was accompanied by the formation of a bearish candlestick pattern, a technical indicator often signaling further downside potential. One of the key technical indicators to watch is the 21-period Simple Moving Average (SMA). The index remains positioned below this moving average, which now acts as a critical resistance level. When an asset trades below its moving average, it often signals a bearish trend, and in this case, the 21-period SMA is capping any potential upward movement.
Looking at the daily chart, the support around the 12,105.00 level remains a critical zone for the index. This level has held firm in recent sessions, and its ability to continue providing support could be pivotal in determining whether the index experiences a rebound or continues its downward trajectory.
Our Stance: It could be said that the worries related to the trade policies continue to impact the sentiments of the global and NZ investors. Because of the tensions associated with the trade wars, the market players are required to be mindful when it comes to investing into equities. RBNZ also stated that global economic growth is anticipated to remain subdued over the near term. Geopolitics, which include uncertainty about trade barriers, can weaken global growth.


 Please wait processing your request...