
Image Source : Krish Capital Pty Ltd
Index Update: On 14th February 2025, the NZ market ended in green amidst broad-based buying. On the same day, S&P/NZX 50 Index encountered a rise of 0.64% to end the session at 12,989.180 and S&P/NZX 20 Index rose by 0.62% to close at 7,793.940. Also, S&P/NZX 10 Index encountered an increase of 0.82% to 13,109.350. Also, significant buying was encountered in the energy sector, with S&P/NZX All Energy increasing by 1.54%.
Macro Update: As per Stats NZ, food prices across Aotearoa New Zealand increased 1.9% in January 2025, after a 0.1% increase in December 2024. Around 65% of items priced in the food basket were more expensive in January 2025 as compared to an average of 54% per month in 2024. The proportion of the food basket which increased by over 5% in price was the highest in five years. The increased prices for grocery food contributed the most to the January 2025 increase, with elevated prices for boxed chocolates, milk, and chocolate blocks.
Top Market Movers: Among top gainers, Black Pearl Group Limited (NZX: BPG) encountered an increase of 11.63% to $0.96 per share. On the other hand, Trade Window Holdings Limited (NZX: TWL) declined by 4.65%.
Commodity Update: The U.S. dollar and major currencies remained stable on Friday as traders evaluated the impact of Washington's planned reciprocal tariffs, which will not be immediately enforced. U.S. President Donald Trump instructed his economic team to develop plans for tariffs on countries taxing U.S. imports. Meanwhile, a U.S. producer price report alleviated concerns about inflation. Commodities have mixed performance: gold gained 0.35% to $2955.80, silver rose 1.58% to $33.24, and copper increased by 0.45% to $9533.95. Brent oil dropped 0.21% to $75.02, recovering from earlier losses as the tariff announcements were postponed until at least April, easing trade war fears.
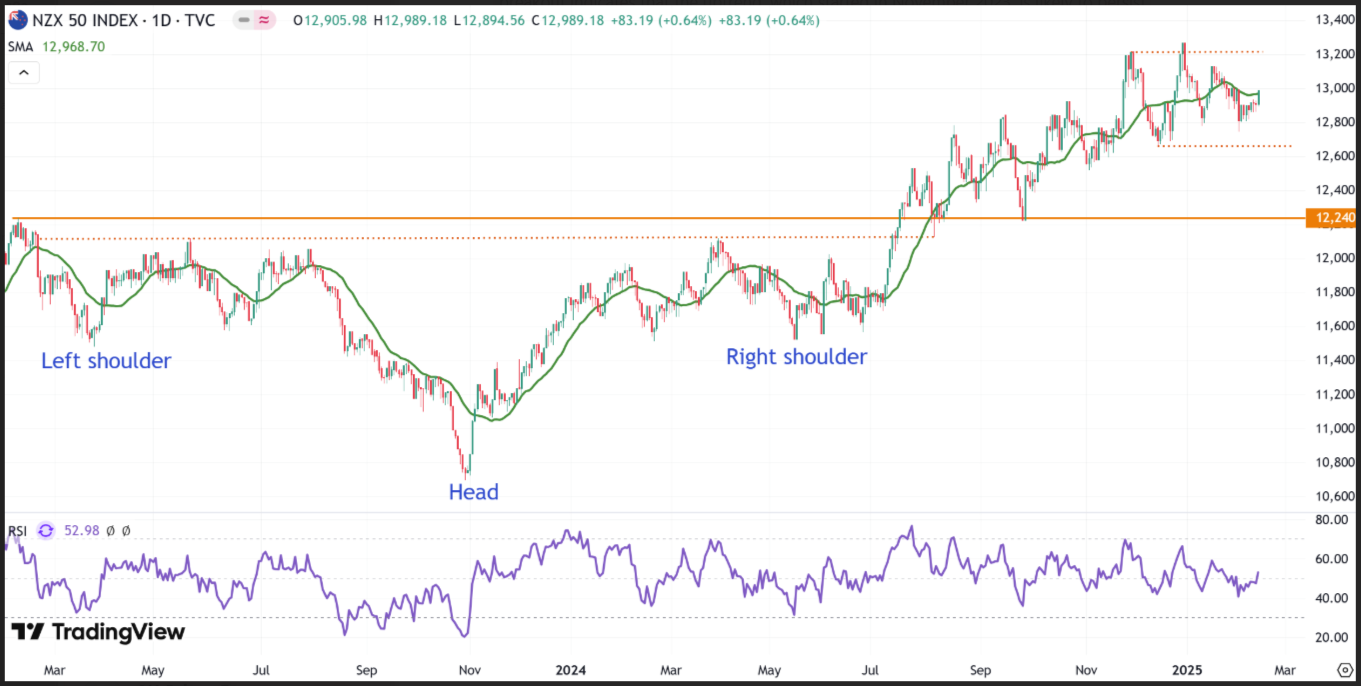
Source: Trading View, Analysis: Kalkine Group
In July 2024, the S&P/NZX 50 index surpassed both the neckline of a Head and Shoulders pattern on the daily chart and a key resistance level marked by its 2023 high. This breakout indicates that the uptrend, which started in November 2023, is likely to persist and could push the index toward its historical peak from 2021. Despite the ongoing correction, the index continues to establish higher highs and higher lows, confirming the prevailing uptrend. Meanwhile, the 14-day Relative Strength Index (RSI) is heading north from its midpoint, reflecting positive market sentiment in the short-term.
Our Stance: It could be said that the broader NZ market was affected by the buying in energy sector. Moving forward, the market players are required to monitor trade policy developments as these can result in potential market fluctuations. As of now, the broader equity markets are being impacted by the earnings reports and the growth expectations of the US economy. On 20th February, data about initial jobless claims is expected to be released, which can provide some hints about the health of the US economy.


 Please wait processing your request...