
Image Source : Krish Capital Pty Ltd
Index Update: On 19th February 2025, the broader NZ market closed in red amidst decline in the financials sector. On the same day, S&P/NZX 50 Index witnessed a fall of 0.14% to end at 13,033.360 and S&P/NZX 20 Index declined by 0.17% to 7,839.670. Also, S&P/NZX 10 Index encountered a decline of 0.21% to 13,002.330. However, the materials sector witnessed robust buying and S&P/NZX All Materials rose by 3.13% to 1,181.740.
Macro Update: Stats NZ released data about business price indexes (December 2024 quarter). In the December 2024 quarter, the output producers price index (PPI) declined 0.1% and the input PPI fell 0.9% as compared to the September 2024 quarter. Over the same period, the farm expenses price index (FEPI) fell 0.1% and the capital goods price index (CGPI) increased 0.4%. The largest output industry contributions were from electricity, gas, water and waste services (down 25.3%), agriculture, forestry and fishing (up 5.9%) and manufacturing (up 1.1%).
Top Market Movers: Among top gainers, NZ Windfarms Limited (NZX: NWF) witnessed a rise of 85.95% to end the session at $0.225 per share. On the other hand, Black Pearl Group Limited (NZX: BPG) declined 12.50% to $0.84 per share.
Commodity Update: The U.S. dollar remained steady on Wednesday, bolstered by concerns over tariffs and ongoing Russia-Ukraine tensions. Meanwhile, the New Zealand dollar fell after the central bank enacted a large interest rate cut. In the commodities market, gold slipped 0.15% to $2944.50, silver dropped 0.56% to $33.18, and copper declined 0.48% to $9418.10. Brent oil rose 0.20% to $76.04, driven by oil supply disruptions in the U.S. and Russia, while markets awaited further clarity on Ukraine peace talks. Investors are closely eyeing the upcoming Federal Reserve minutes for insights into future rate decisions and policy.
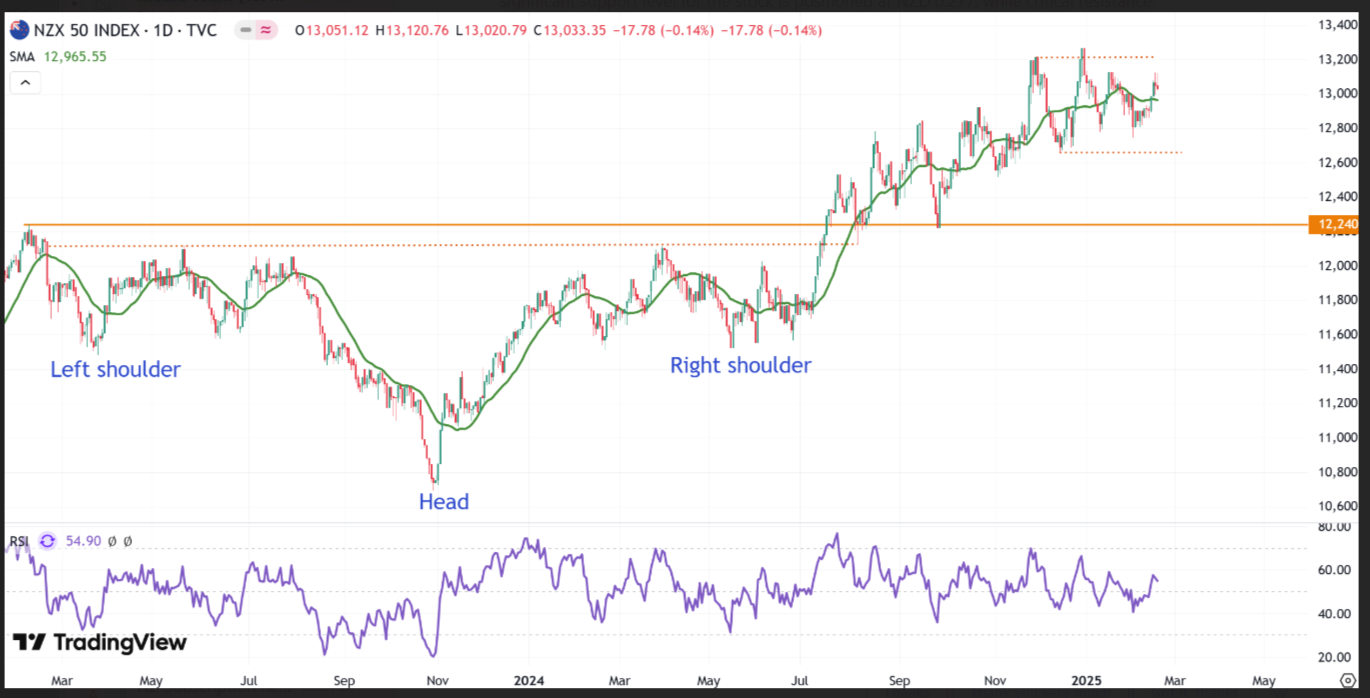
Source: Trading View, Analysis: Kalkine Group
In July 2024, the S&P/NZX 50 index surpassed both the neckline of a Head and Shoulders pattern on the daily chart and a key resistance level marked by its 2023 high. This breakout indicates that the uptrend, which started in November 2023, is likely to persist and could push the index toward its historical peak from 2021. Despite the ongoing correction, the index continues to establish higher highs and higher lows, confirming the prevailing uptrend. Meanwhile, the 14-day Relative Strength Index (RSI) is heading north from its midpoint, reflecting positive market sentiment in the short-term.
Our Stance: While the broader global markets are being affected by the earnings reports, the market players are required to assess the potential implications of the tariffs amidst uncertainty related to the trade policies. Notably, the US President Donald Trump announced that the US tariffs on imported cars would be ~25%. While these announcements can affect the broader markets, it seems that the market players are waiting for the S&P flash U.S. manufacturing PMI data. Moving forward, the investors are required to carefully assess such macro-economic indicators before making investment decisions.


 Please wait processing your request...