Palo Alto Networks Inc
Palo Alto Networks, Inc. (NASDAQ: PANW) is a global cybersecurity provider. The Company's cybersecurity platforms and services help secure enterprise users, networks, clouds and endpoints by delivering cybersecurity backed by artificial intelligence and automation. It focuses on delivering value in four areas: Network Security, Cloud Security, Security Operations and Threat Intelligence and Security Consulting.
Recent Financial and Business Updates:
- Strong Financial Performance in Q2 2024: Palo Alto Networks reported robust financial results for its fiscal second quarter ended January 31, 2024. The cybersecurity leader achieved a remarkable 19% year-over-year growth in total revenue, reaching USD 2.0 billion. This significant expansion reflects the company's ongoing success in the dynamic cybersecurity landscape.
- Key Financial Metrics: The fiscal second quarter witnessed impressive performance across various financial metrics. Remaining performance obligation demonstrated a substantial 22% year-over-year growth, reaching USD 10.8 billion, showcasing sustained demand for Palo Alto Networks' offerings. Additionally, the non-GAAP operating margin experienced remarkable growth, expanding by 580 basis points year over year to reach 29%, highlighting the company's commitment to operational excellence.
- Net Income and Earnings Per Share: The GAAP net income for the fiscal second quarter 2024 was USD 1.7 billion, or USD 4.89 per diluted share, a substantial increase from USD 0.1 billion, or USD 0.25 per diluted share, in the same period the previous year. The fiscal second quarter 2024 GAAP net income included a notable USD 1.5 billion net tax benefit resulting from the release of the company's valuation allowance. Non-GAAP net income for the same period was USD 0.5 billion, or USD 1.46 per diluted share, reflecting sustained profitability and growth.
- Strategic Vision and Future Outlook: The strategic focus includes activating an accelerated platformization and consolidation strategy, aligning with an AI leadership strategy. Despite making significant investments in these strategies, Palo Alto Networks remains confident in maintaining its fiscal year 2024 non-GAAP EPS and free cash flow guidance, showcasing a balanced approach toward sustained growth.
- Financial Outlook for Q3 2024 and Fiscal Year 2024: Palo Alto Networks provided insightful guidance based on prevailing market conditions. For the fiscal third quarter 2024, the company expects total billings in the range of USD 2.30 billion to USD 2.35 billion, representing year-over-year growth of 2% to 4%. Total revenue is anticipated to be in the range of USD 1.95 billion to USD 1.98 billion, with year-over-year growth between 13% and 15%. Diluted non-GAAP net income per share is projected to be in the range of USD 1.24 to USD 1.26, using 347 million to 351 million shares outstanding. For the fiscal year 2024, Palo Alto Networks adjusted its guidance, expecting total billings in the range of USD 10.10 billion to USD 10.20 billion, reflecting year-over-year growth of 10% to 11%. Total revenue is projected to be in the range of USD 7.95 billion to USD 8.00 billion, showcasing year-over-year growth between 15% and 16%. The company anticipates a non-GAAP operating margin in the range of 26.5% to 27.0%, with diluted non-GAAP net income per share ranging from USD 5.45 to USD 5.55, using 345 million to 347 million shares outstanding. The adjusted free cash flow margin is expected to fall within the range of 38.0% to 39.0%.
Technical Observation (on the daily chart)
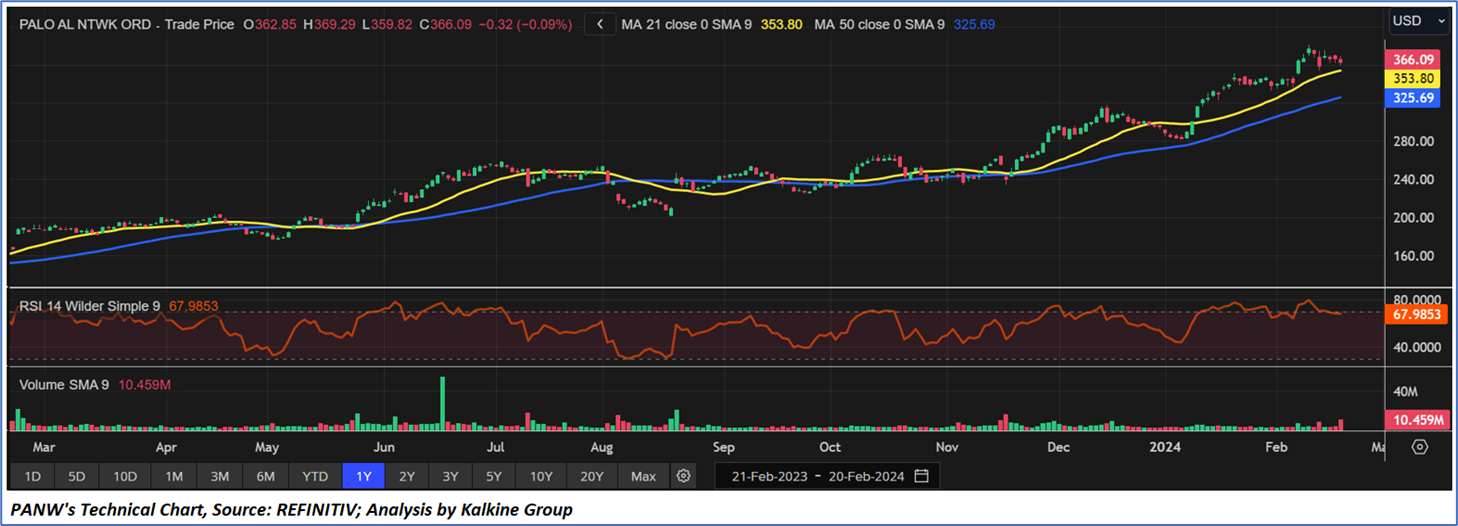
The Relative Strength Index (RSI), calculated over a 14-day span, stands at 67.98, recovering from the overbought zone, signifying the likelihood of either some consolidation or a healthy correction to important support levels of USD 240-260. Adding to this, the stock presently finds itself positioned above both the 21-day and 50-day Simple Moving Averages (SMA), which could function as a dynamic short-term support levels.
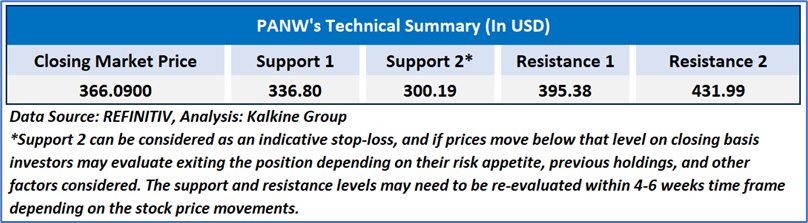
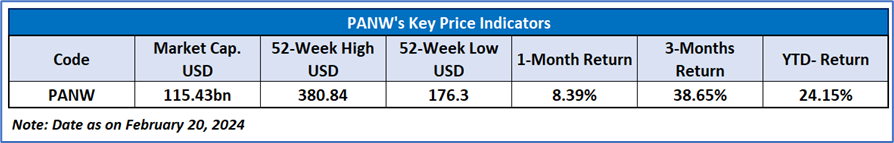
As per the above-mentioned price action, recent key business and financial updates, lowered FY24 outlook, momentum in the stock over the last month, and technical indicators analysis, a ‘WATCH’ rating has been given to Palo Alto Networks, Inc. (NASDAQ: PANW) at the closing market price of USD 366.09, as of February 20, 2024.
Individuals can evaluate the stock based on the support and resistance levels provided in the report in case of keen interest taking into consideration the risk-reward scenario.
Markets are trading in a highly volatile zone currently due to certain macro-economic issues and prevailing geopolitical tensions. Therefore, it is prudent to follow a cautious approach while investing.
How to Read the Charts?
The yellow colour line reflects the 21-period simple moving average (SMA) while the blue line indicates the 50- period simple moving average (SMA). SMA helps to identify existing price trends. If the prices are trading above the 21-period and 50-period moving average, then it shows prices are currently trading in a bullish trend.
The orange colour line in the chart’s lower segment reflects the Relative Strength Index (14-Period) which indicates price momentum and signals momentum in trend. A reading of 70 or above suggests overbought status while a reading of 30 or below suggests an oversold status.
The red and green colour bars in the chart’s lower segment show the volume of the stock. The volume is the number of shares that changed hands during a given day. Stocks with high volumes are more liquid than stocks with lesser volume as liquidity in stocks helps with easier and faster execution of the order.
The Orange colour lines are the trend lines drawn by connecting two or more price points and used for trend identification purposes. The trend line also acts as a line of support and resistance.
Technical Indicators Defined: -
Support: A level at which the stock prices tend to find support if they are falling, and a downtrend may take a pause backed by demand or buying interest. Support 1 refers to the nearby support level for the stock and if the price breaches the level, then Support 2 may act as the crucial support level for the stock.
Resistance: A level at which the stock prices tend to find resistance when they are rising, and an uptrend may take a pause due to profit booking or selling interest. Resistance 1 refers to the nearby resistance level for the stock and if the price surpasses the level, then Resistance 2 may act as the crucial resistance level for the stock.
Stop-loss: It is a level to protect further losses in case of unfavourable movement in the stock prices.
Abbreviations
CMP: Current Market Price
SMA: Simple Moving Average
RSI: Relative Strength Index
USD: United States dollar
Note 1: Past performance is not a reliable indicator of future performance.
Note 2: The reference date for all price data, currency, technical indicators, support, and resistance levels is February 20, 2024. The reference data in this report has been partly sourced from REFINITIV.
Note 3: Investment decisions should be made depending on an individual's appetite for upside potential, risks, holding duration, and any previous holdings. An 'Exit' from the stock can be considered if the Target Price mentioned as per the Valuation and or the technical levels provided has been achieved and is subject to the factors discussed above.
Note 4: The report publishing date is as per the Pacific Time Zone.
Disclaimer
Kalkine New Zealand Limited is a Financial Advice Provider (“FAP”) and is authorised by a Class 1 Financial Advice Provider Licence issued by Financial Markets Authority (“FMA”) to provide financial advice. Kalkine provides only general financial advice through its research reports following a person becoming a member. The reports contain buy/sell/hold and other recommendations in relation to equity financial products. The recommendations and opinions [on this website] / [in this report] do not take into account any of your investment objectives, financial situation or needs. Before you make a decision about whether to acquire a financial product, you should obtain the Product Disclosure Statement from the product issuer. You should consider the appropriateness of advice taking into account your own objectives, financial situation and needs and seek independent financial advice before making any financial decisions. If you act on the advice in the research reports, you may have to pay fees, expenses or other amounts (but not to Kalkine). Further information about the complaints and dispute resolution process, as well as information about Kalkine’s duties are available on Kalkine’s website. Please read our Financial Advice Provider (FAP) disclosure statement and Complaints Handling Guide, which are available on the website.

 Please wait processing your request...