
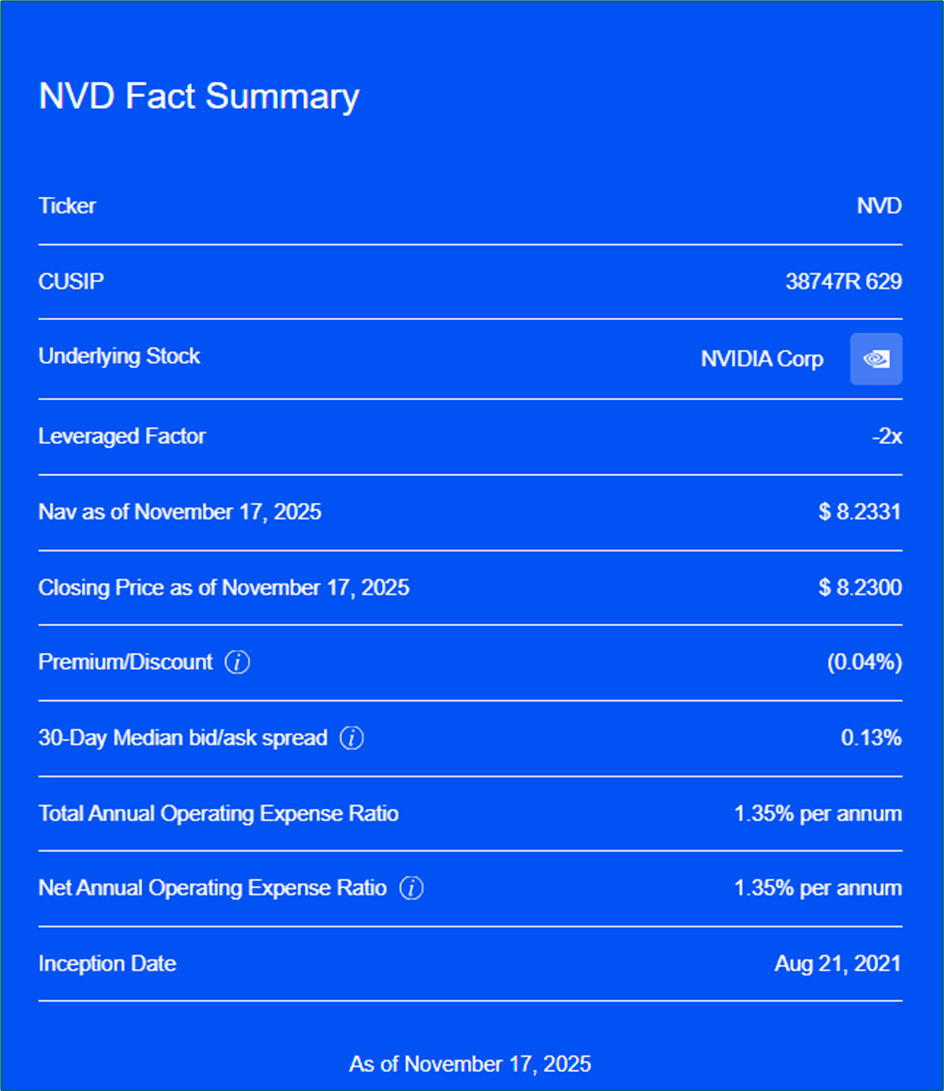
Section 1: GraniteShares 2x Short NVDA Daily ETF
The Fund seeks daily leveraged investment results of two times (200%) the daily percentage change in the share price of NVIDIA Corporation (NASDAQ: NVDA). The Fund may enter into one or more swap agreements with financial institutions for a specified period, which may range from one day to longer than a year.
Its performance over extended periods diverges from the expected 200% due to the compounding effect of daily returns, which is influenced by factors like holding duration and stock volatility. High volatility amplifies the impact of compounding, potentially leading to significant deviations from the underlying stock’s performance. Consequently, this ETF is designed for short-term trading rather than buy-and-hold strategies.
Underlying Stock: NVIDIA Corporation (NASDAQ: NVDA)
NVIDIA Corporation (NASDAQ: NVDA) is a full-stack computing infrastructure company. The Company is engaged in accelerated computing to help solve the challenging computational problems. The Company’s segments include Compute & Networking and Graphics.
Section 2: Technical Analysis on ETF and Underlying Asset
NASDAQ: NVD
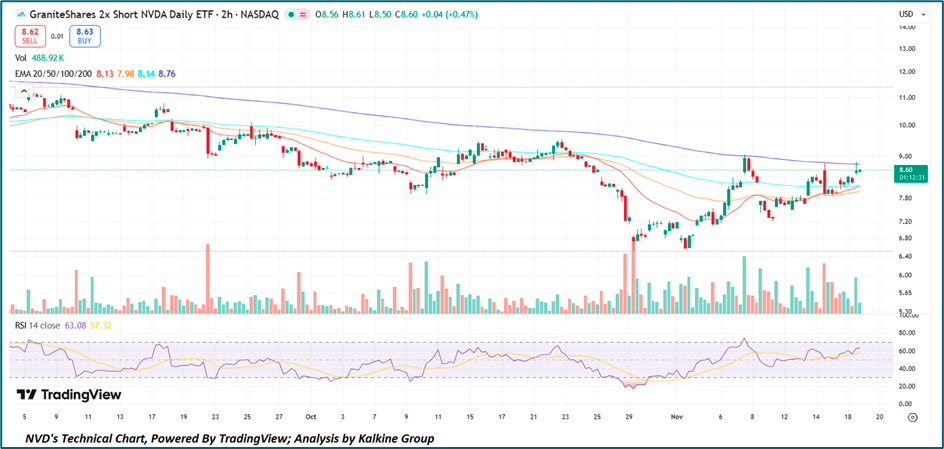
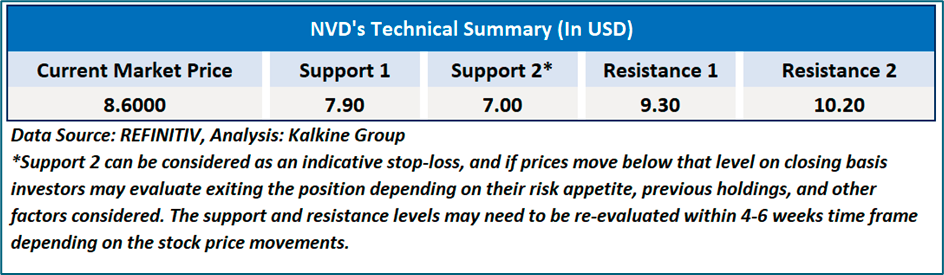
NVD is exhibiting improving short-term technical strength, with the price rebounding toward USD 8.60 and attempting to break above key intermediate resistance near the 200-period EMA on the 2-hour chart, signalling a potential shift in momentum after a prolonged downtrend. The shorter-term EMAs (20/50/100) have begun to compress and slope upward, indicating early signs of trend stabilisation, while the sustained pickup in buying volume reinforces strengthening bullish participation at lower levels. Additionally, the RSI around 63 reflects firm positive momentum without yet entering overbought territory, suggesting scope for further upside if resistance breaks convincingly. Overall, while NVD remains technically sensitive given its inverse leveraged structure, recent price action reflects improving sentiment and a constructive near-term setup, contingent on maintaining support above the USD 7.80–8.00 region.
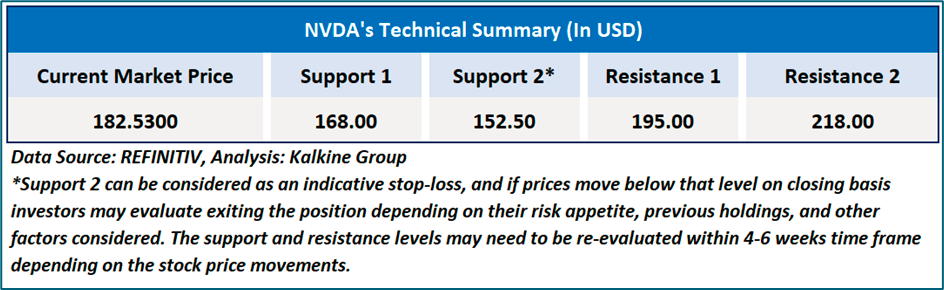
Underlying Asset Analysis: NASDAQ: NVDA
NVIDIA (NVDA) is exhibiting signs of short-term technical weakness on the 2-hour chart, as the price has slipped to around USD 182.53 and remains consistently below the 20-, 50-, 100-, and 200-period EMAs, all of which are beginning to slope downward, indicating a developing bearish trend structure. Recent attempts to reclaim the EMA cluster have failed, reinforcing overhead supply near the USD 188–192 zone, while declining volume during minor rebounds suggests waning buyer conviction. Moreover, the RSI near 36 reflects weakening momentum with room to fall further before reaching oversold conditions, underscoring the possibility of continued downside pressure. Overall, unless NVDA recovers and sustains levels above the EMA band, the stock’s near-term outlook remains tilted toward further consolidation or mild downside drift.
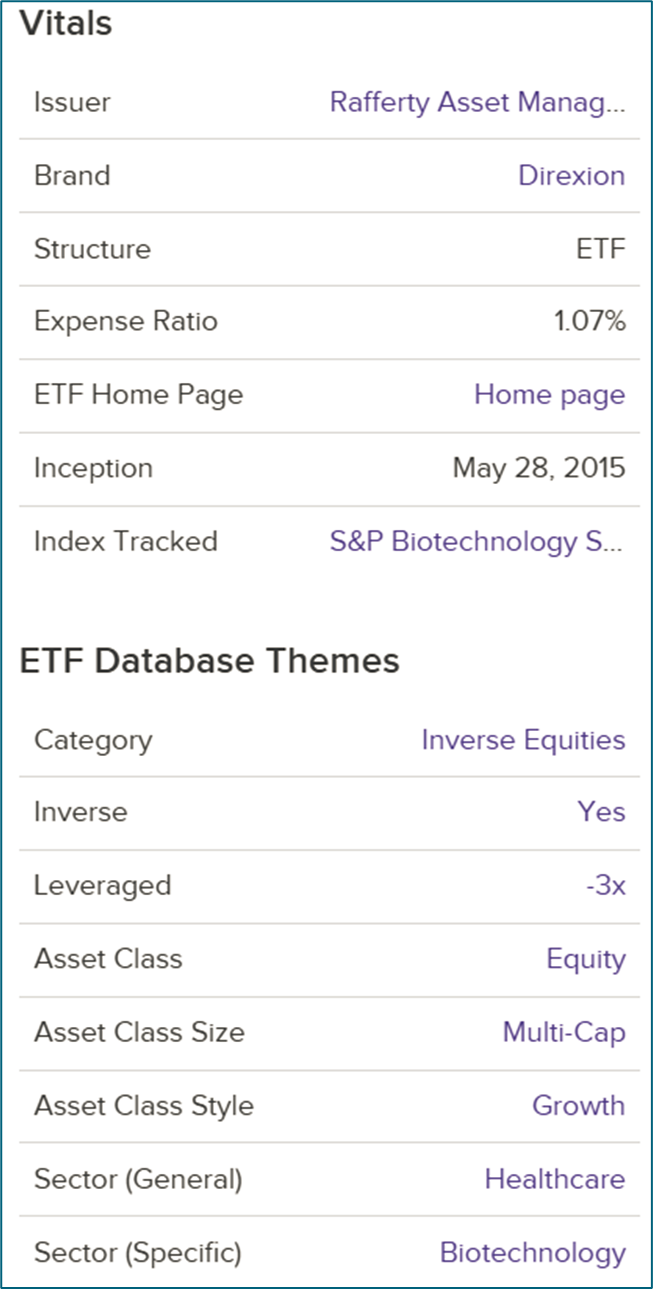
Section 1: Direxion Daily S&P Biotech Bear 3X Shares
The Fund seeks daily investment results, before fees and expenses, of three times (300%) the daily percentage change in the price of Biotech shares. The Fund is an actively managed ETF that attempts to achieve two times the daily percentage change in the share price of the Underlying Security.
Its performance over extended periods diverges from the expected 300% due to the compounding effect of daily returns, which is influenced by factors like holding duration and stock volatility. High volatility amplifies the impact of compounding, potentially leading to significant deviations from the underlying stock’s performance. Consequently, this ETF is designed for short-term trading rather than buy-and-hold strategies.
Section 2: Technical Analysis on ETF and Underlying Asset
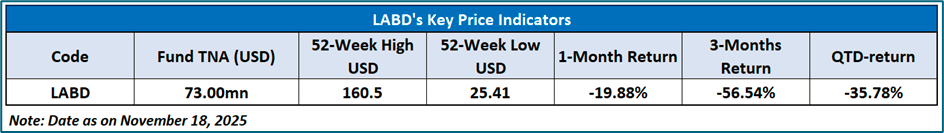
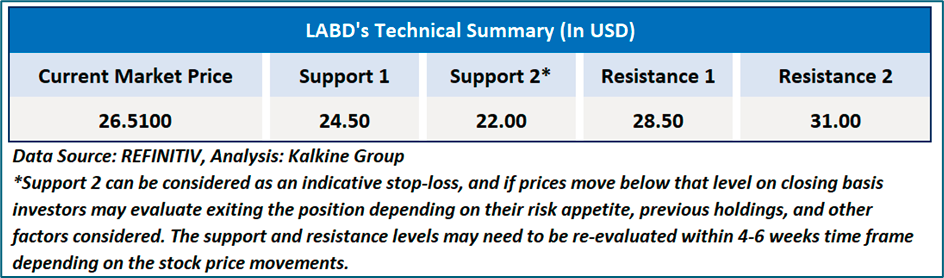
NYSE: LABD
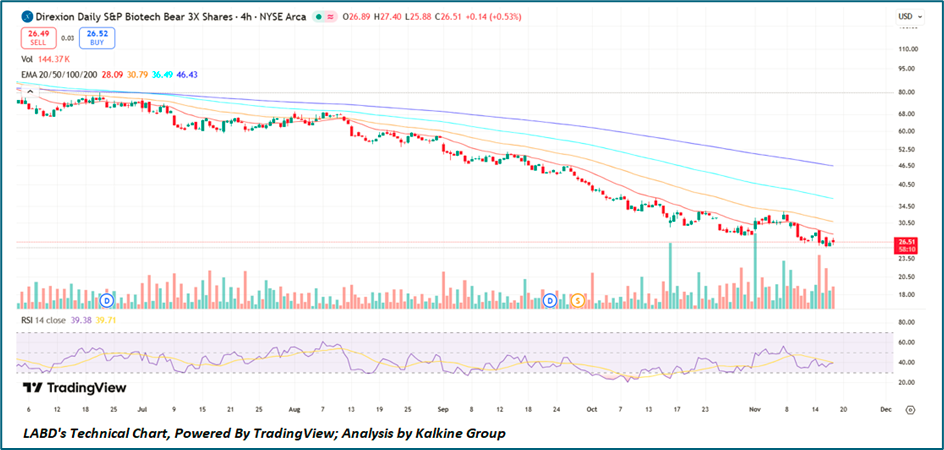
LABD continues to exhibit a firmly bearish technical structure on the 4-hour chart, with the price hovering near USD 26.51 and persistently trading below the 20-, 50-, 100-, and 200-period EMAs, all of which maintain pronounced downward slopes that confirm sustained selling pressure. Multiple failed attempts to reclaim the short-term EMA band highlight the presence of strong overhead resistance around the USD 28–31 range, while volume patterns show limited accumulation despite intermittent spikes, suggesting weak conviction from buyers. The RSI near 39 reflects subdued momentum and a continuation of the broader downtrend, with no clear signs of a bullish reversal emerging. Overall, unless LABD decisively breaks above the declining EMA stack, the ETF remains technically weak, with the risk of further drift lower dominating near-term expectations.
Related Risk: Investing in the Fund carries inherent risks, including potential losses. The Fund's NAV and performance are influenced by various factors. Key risks include the effects of compounding, market volatility, and underlying stock risks, which can significantly impact returns and increase the likelihood of financial losses.
This report (“Report”) has been issued by Kalkine New Zealand Limited (FSP691351) (NZBN:9429047678101) (“Kalkine”). Kalkine is a Financial Advice Provider (“FAP”) and is authorised by a Class 1 Financial Advice Provider Licence issued by Financial Markets Authority (“FMA”) to provide financial advice. Kalkine provides only general financial advice through its research reports following a person becoming a member. The reports contain buy/sell/hold and other recommendations in relation to equity securities, managed funds and other managed investment schemes and other financial advice products. The recommendations and opinions in this Report and on Kalkine website do not take into account any of your investment objectives, financial situation or needs. Before you make a decision about whether to acquire a financial product, you should obtain the Product Disclosure Statement from the product issuer. You should consider the appropriateness of advice taking into account your own objectives, financial situation and needs and seek independent financial advice before making any financial decisions. If you act on the advice in the research reports, you may have to pay fees, expenses or other amounts (but not to Kalkine).
The information in this Report and on the Kalkine website has been prepared from a wide variety of sources, which Kalkine, to the best of its knowledge and belief, considers accurate. Kalkine has made every effort to ensure the reliability of the information contained in its reports (including this Report), newsletters and websites. All information represents our views at the date of publication and may change without notice.
Kalkine does not issue, sell or deal in any financial products. The information in this Report does not constitute an offer to sell securities or other financial products or a solicitation of an offer to buy securities or other financial products. Our reports contain general recommendations to invest in securities and other financial products. Kalkine is not responsible for, and does not guarantee, the performance of, or returns on, any investments mentioned in this Report.
This Report may contain information on past performance of particular investments. Past performance is not a reliable indicator of future performance. Returns stated do not take into account transaction costs and taxes.
Further information about the complaints and dispute resolution process, as well as information about Kalkine’s duties are available on Kalkine’s website. Please read our Financial Advice Provider (FAP) disclosure statement and Complaints Handling Guide, which are available on the website.
Copyright 2025 Krish Capital Pty. Ltd. (ABN 61629651510). All Rights Reserved. No part of this Report, or its content, may be reproduced in any form without our prior consent.
Past performance is not a reliable indicator of future performance.
 Please wait processing your request...