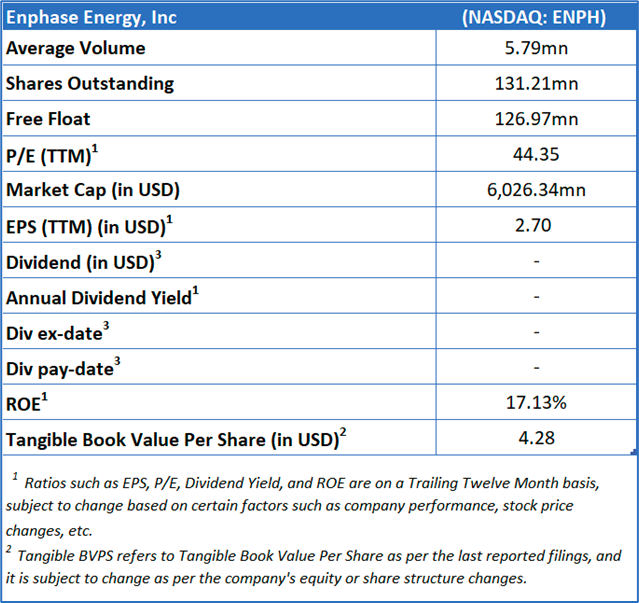
Enphase Energy, Inc
Enphase Energy, Inc. (NASDAQ: ENPH) is a worldwide energy technology firm that provides microinverter-based solar and battery solutions. These systems allow individuals to generate, use, store, and sell their own solar power, all managed through an intelligent mobile app.
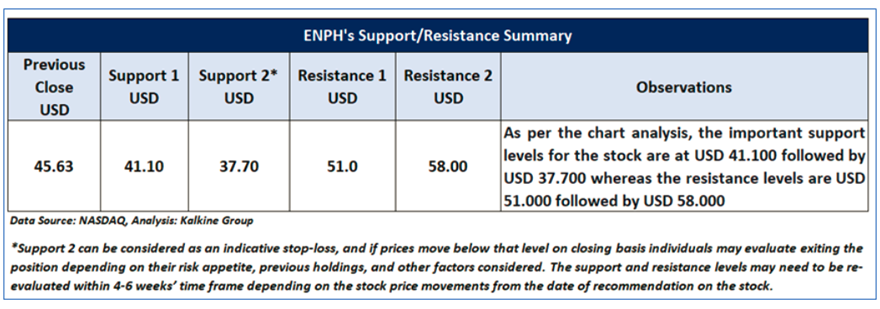
As per our previous Global Big Money Report published on ‘ENPH’ on May 13, 2025, Kalkine provided an ‘Buy’ stance on the stock at USD 45.63 based on fundamental analysis and the stock price has now moved by ~ 0.66% since then and is hovering around resistance 1.
Noted below are the details of support and resistance levels provided in our previous report:
Rationale – Sell at USD 45.93
- Revenue Decline and Seasonal Weakness: In the first quarter of 2025, Enphase Energy experienced a sequential decline in total revenue, dropping to USD 356.1 million from USD 382.7 million in Q4 2024. This 7% decrease was primarily attributed to seasonal factors and softening demand in the United States. Notably, U.S. revenue fell by approximately 13% quarter-over-quarter, partially offset by USD 54.3 million in safe harbor revenue. While European markets showed resilience with a 7% revenue increase, the overall slowdown in the core U.S. market points to ongoing demand challenges and heightened exposure to regional macroeconomic conditions.
- Margin Compression Due to Product Mix and IRA Benefit Fluctuations: Enphase's gross margins also contracted in Q1 2025. On a non-GAAP basis, the gross margin decreased from 53.2% in Q4 2024 to 48.9%, largely due to a less favorable product mix and reduced bookings of 45X production tax credits. When excluding the net benefit from the Inflation Reduction Act (IRA), the gross margin was just 38.3%, down from 39.7% in the previous quarter. This reveals potential vulnerability in the company’s profitability, especially if reliance on government incentives like the IRA continues to play a critical role in maintaining margin strength.
- Reduced Profitability and Operating Leverage: Despite posting a significant year-over-year turnaround from losses in Q1 2024, Enphase saw a notable decline in profitability compared to the previous quarter. Non-GAAP operating income dropped to USD 94.6 million from USD 120.4 million in Q4 2024, while net income also fell from USD 125.9 million to USD 89.2 million. The company cited lower gross profit and seasonal impacts as key contributors. Additionally, GAAP operating income and net income fell more sharply, reflecting accounting impacts from restructuring efforts and convertible note repayments. These figures suggest a temporary decline in operational efficiency.
- Increasing Capital and Shareholder Return Outflows: During the quarter, Enphase made significant financial outflows, including the full repayment of USD 102.2 million in convertible senior notes and USD 100 million spent on share repurchases. These actions, while possibly favorable from a capital allocation perspective, reflect a substantial cash usage that may constrain future flexibility. Capital expenditures also rose to USD 14.6 million from USD 8.1 million in Q4, which could indicate rising cost pressures. The company’s move to use USD 12.1 million in share withholding for tax obligations further reduced diluted shares, possibly dampening per-share metrics longer term.
- Exposure to Policy Shifts and Market Dependencies: Enphase remains highly exposed to U.S. energy policies and tax incentives, particularly the 45X production tax credits and domestic content bonus under the IRA. A shift in federal policy, delays in utility approvals, or reduced incentive availability could negatively impact earnings and demand for its products. Moreover, the company’s aggressive product rollout strategy,ranging from EV chargers to portable energy devices, while innovative, may dilute focus and increase operational complexity, especially in newer or less proven markets like portable solar or consumer electronics..
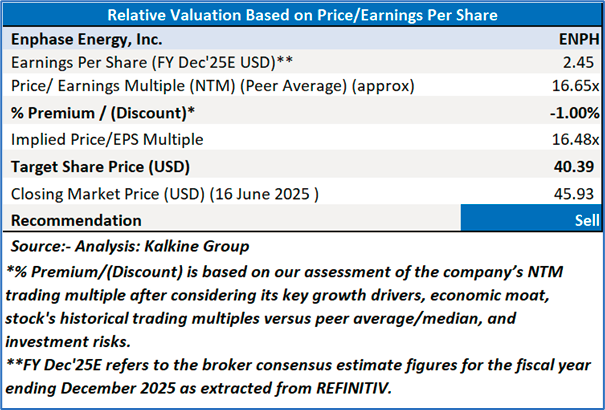
Valuation (Using P/E Multiple)
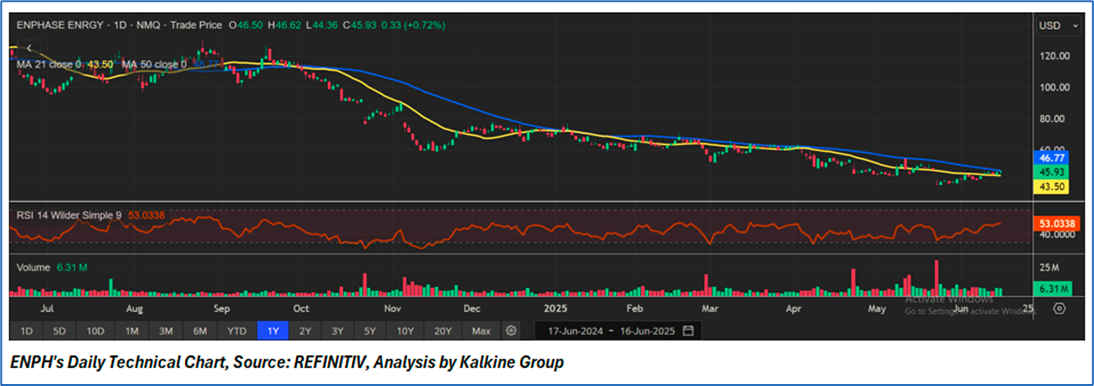
Share Price Chart
Conclusion
Enphase Energy faced a challenging first quarter of 2025, marked by a sequential decline in revenue due to seasonal weakness and softening U.S. demand, despite modest growth in Europe. Profitability also weakened, with both GAAP and non-GAAP margins declining, largely driven by unfavourable product mix and reduced tax credit bookings. Operating income and net earnings dropped from the prior quarter, signaling reduced operating leverage. Additionally, significant cash outflows for debt repayment and share buybacks, combined with increased capital expenditures, could strain financial flexibility. The company’s continued reliance on government incentives and evolving policy frameworks poses additional risks to future performance.
Based on the above rationale, valuation downside and price action, a "Sell" recommendation on Enphase Energy, Inc. (NASDAQ: ENPH) has been given at the closing market price of USD 45.93 as on 16 June 2025.
Note 1: Past performance is not a reliable indicator of future performance.
Note 2: The reference date for all price data, currency, technical indicators, support, and resistance level is 16 June 2025. The reference data in this report has been partly sourced from REFINITIV.
Note 3: Investment decisions should be made depending on an individual's appetite for upside potential, risks, holding duration, and any previous holdings. An 'Exit' from the stock can be considered if the Target Price mentioned as per the Valuation and or the technical levels provided has been achieved and is subject to the factors discussed above.
Note 4: Target Price refers to a price level which the stock is expected to reach as per the relative valuation method and/or technical analysis taking into consideration both short-term and long-term scenario.
Note 5: ‘Kalkine reports are prepared based on the stock prices captured either from the London Stock Exchange (LSE) and or REFINITIV. Typically, both sources (LSE and or REFINITIV) may reflect stock prices with a delay which could be a lag of 15-20 minutes. There can be no assurance that future results or events will be consistent with the information provided in the report. The information is subject to change without any prior notice.’
Note 6: Dividend Yield may vary as per the stock price movement.

 Please wait processing your request...