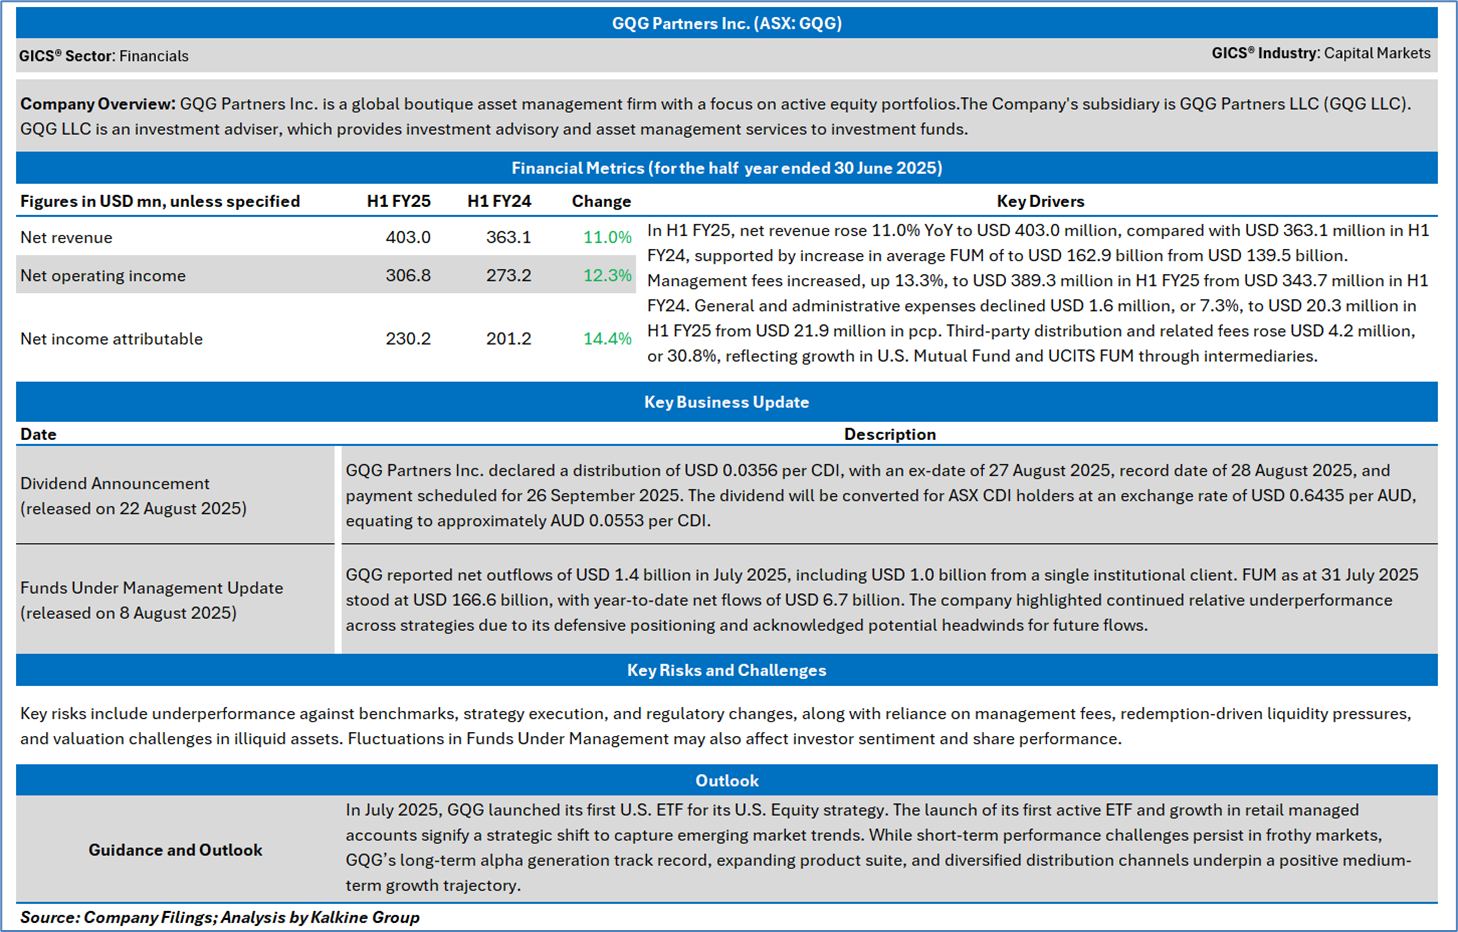
Company Overview: GQG Partners Inc. (ASX: GQG) is a global boutique asset management firm with a focus on active equity portfolios. It is an investment adviser, which provides investment advisory and asset management services to investment funds; separately managed accounts for United States and non-United States investors; mutual funds, and other structures, including pooled investment vehicles. Frontier Digital Ventures Limited (ASX: FDV) is a Malaysia-based company engaged in online marketplace businesses. The Company is an owner and operator of online classifieds marketplaces in fast growing emerging regions. It operates across three regions 360 LATAM, MENA Marketplaces Group and FDV Asia. Kaline’s Daily Report covers the Key Financial Metrics, Risks, Outlook, Technical Analysis along with the Valuation, Target Price, and Recommendation on the stock.
GQG Partners Inc. (ASX: GQG)
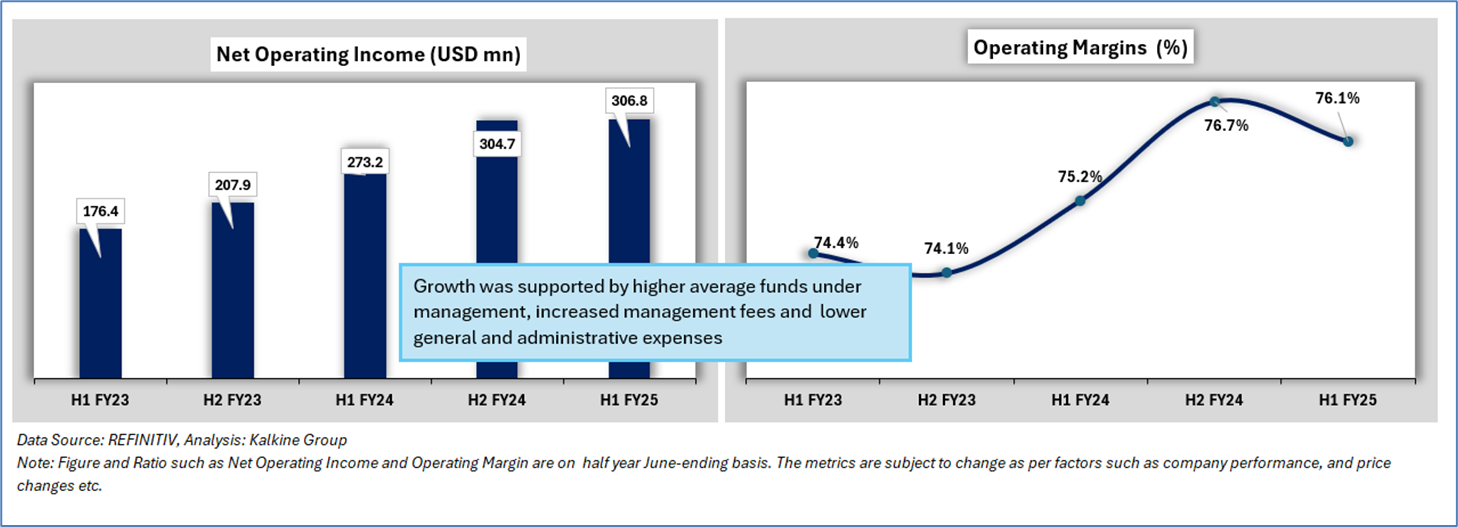
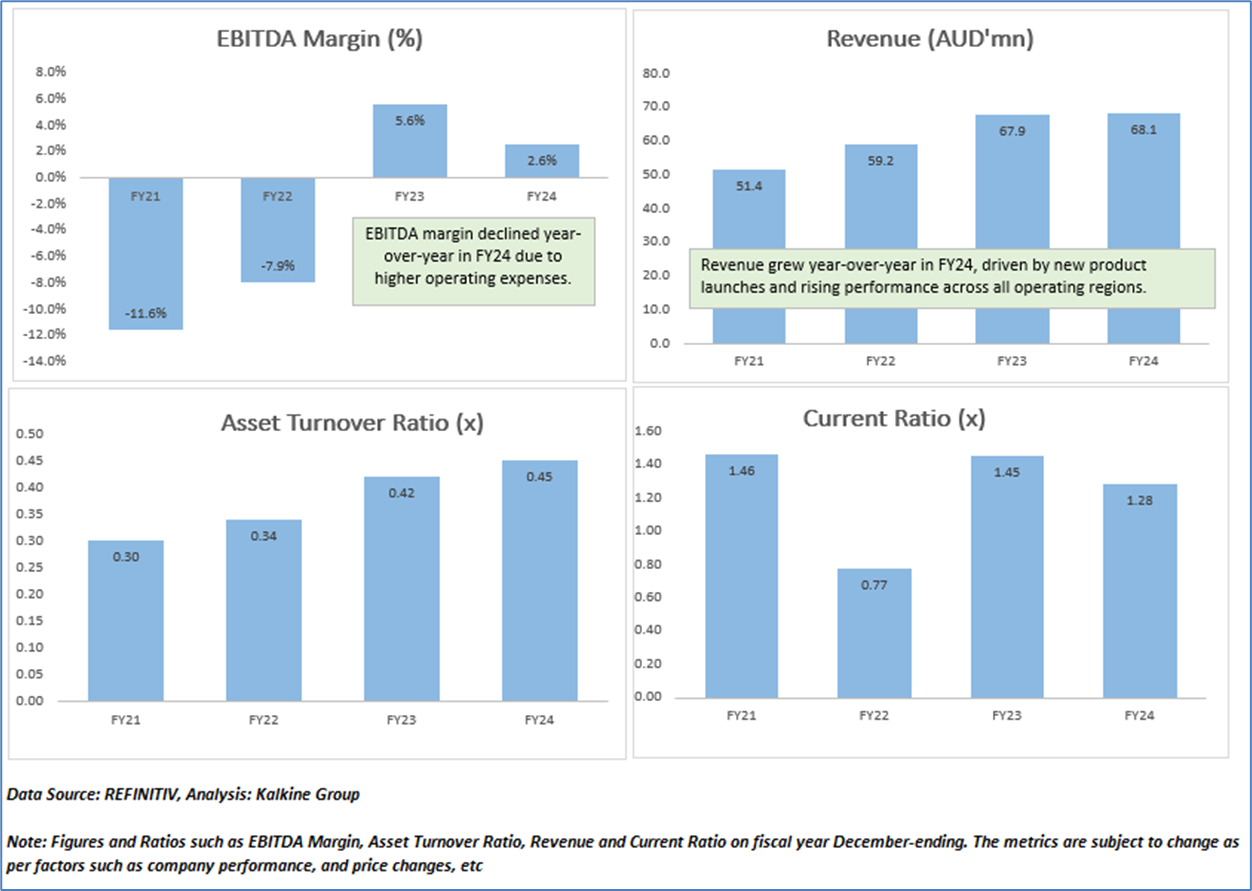
Section 1.0: Key Metrics in Pictures
Having looked at the key financial metrics above the below sections provide an in-depth fundamental, and technical analysis on this Financial Services’ Stock along with recommendation, technical support, and resistance level & indicative stop-loss.
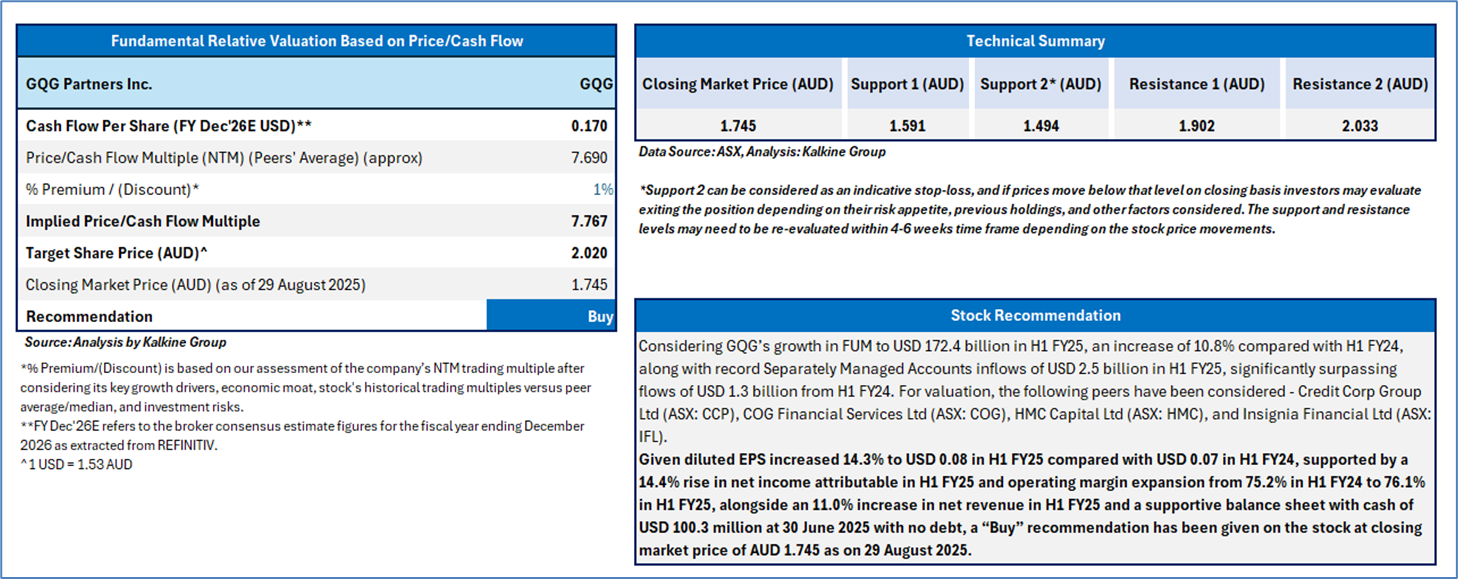
Section 2.0: GQG Partners Inc. (‘Buy’ at AUD 1.745, closing market price per share as on 29 August 2025)
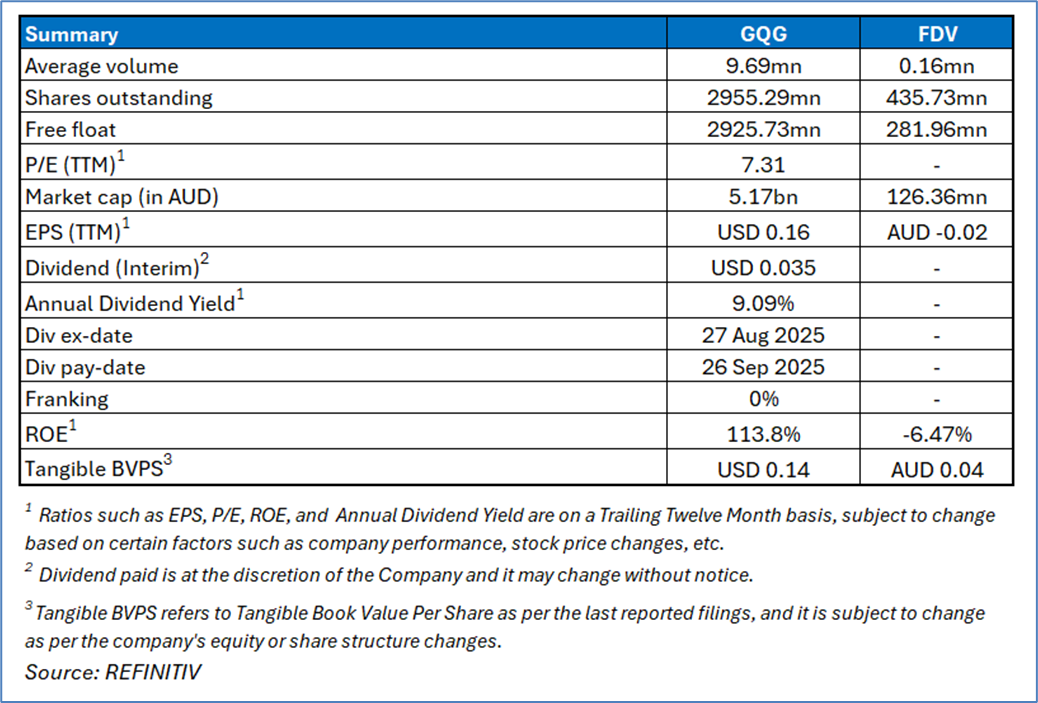
2.1 Company Details
2.2 Valuation, Technical Summary & Stock Recommendation
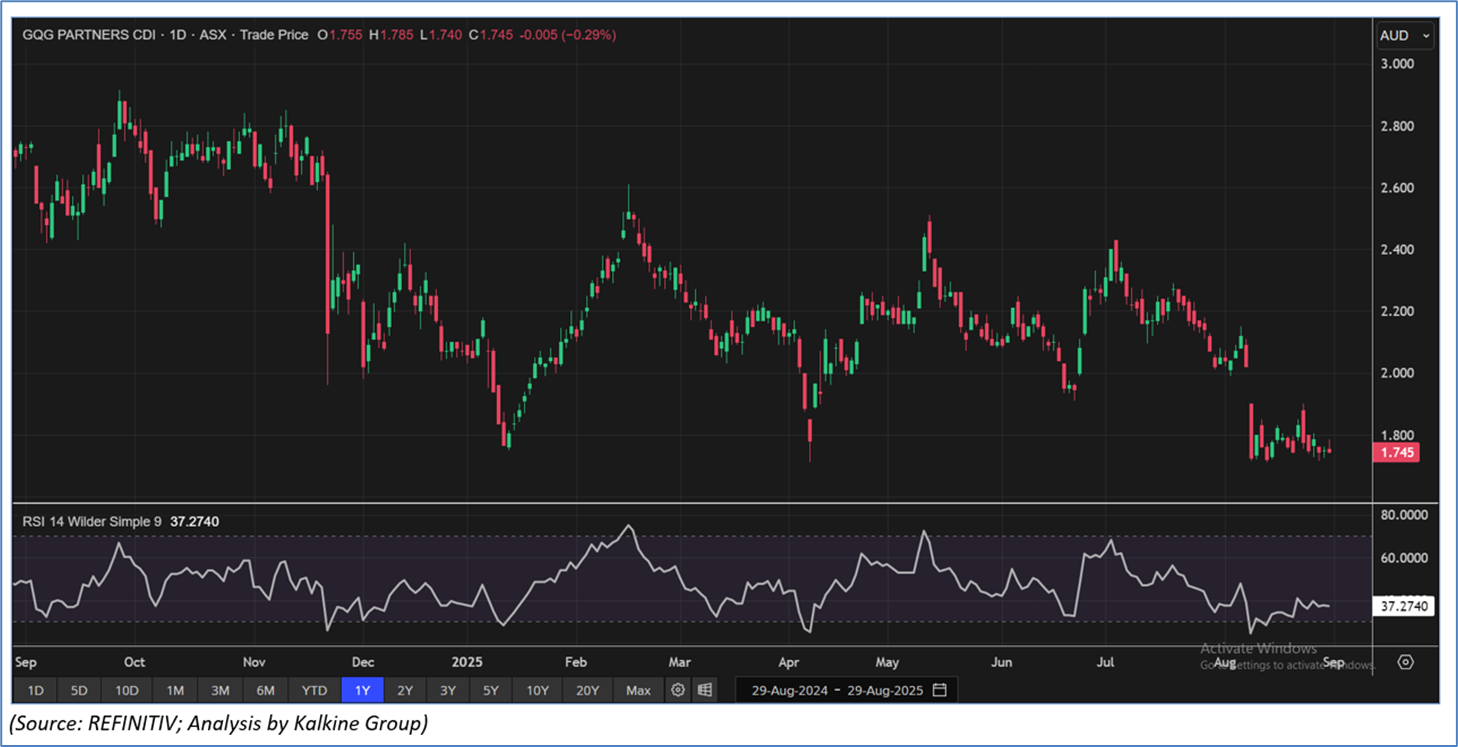
The stock has witnessed a dip of ~15.70% in last one month, and over the last one year, it has corrected by ~35.85%. The stock has a 52-week low and 52-week high of AUD 1.710 and AUD 2.915, respectively and is currently trading close to 52-weel low level. GQG was last covered in a report dated ’12 August 2025’.
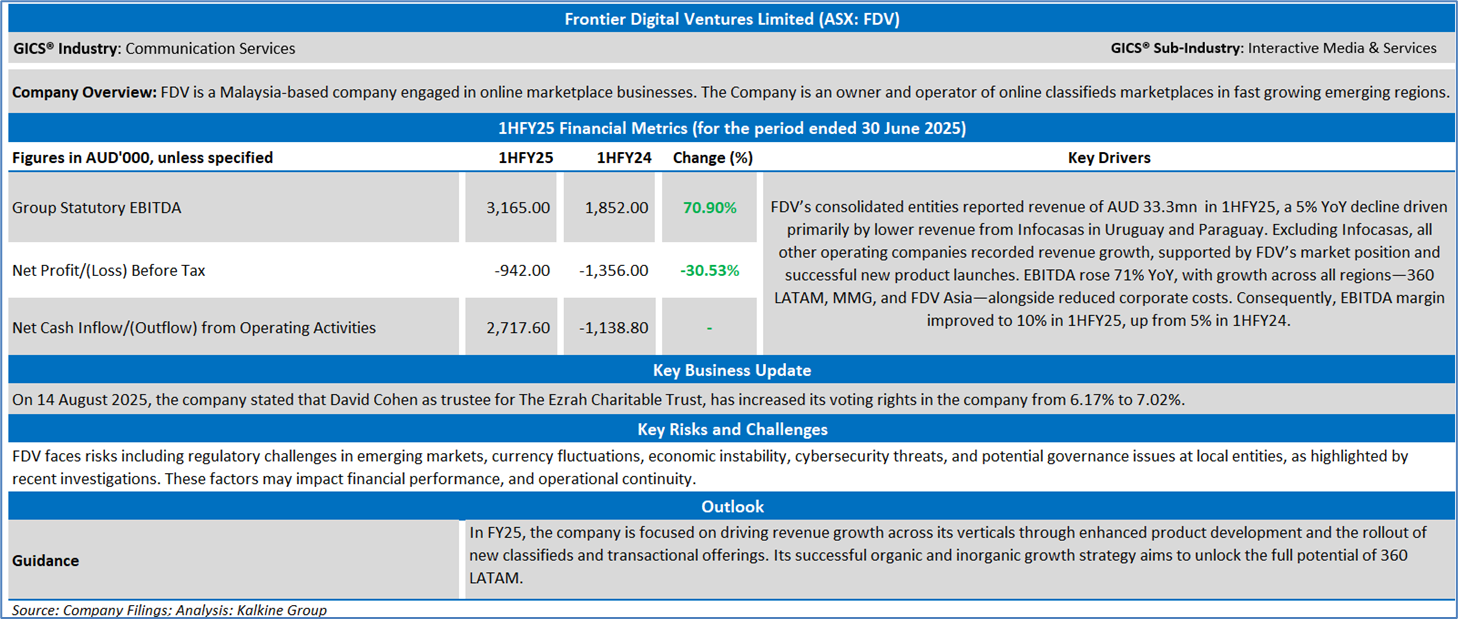
Frontier Digital Ventures Limited (ASX: FDV)
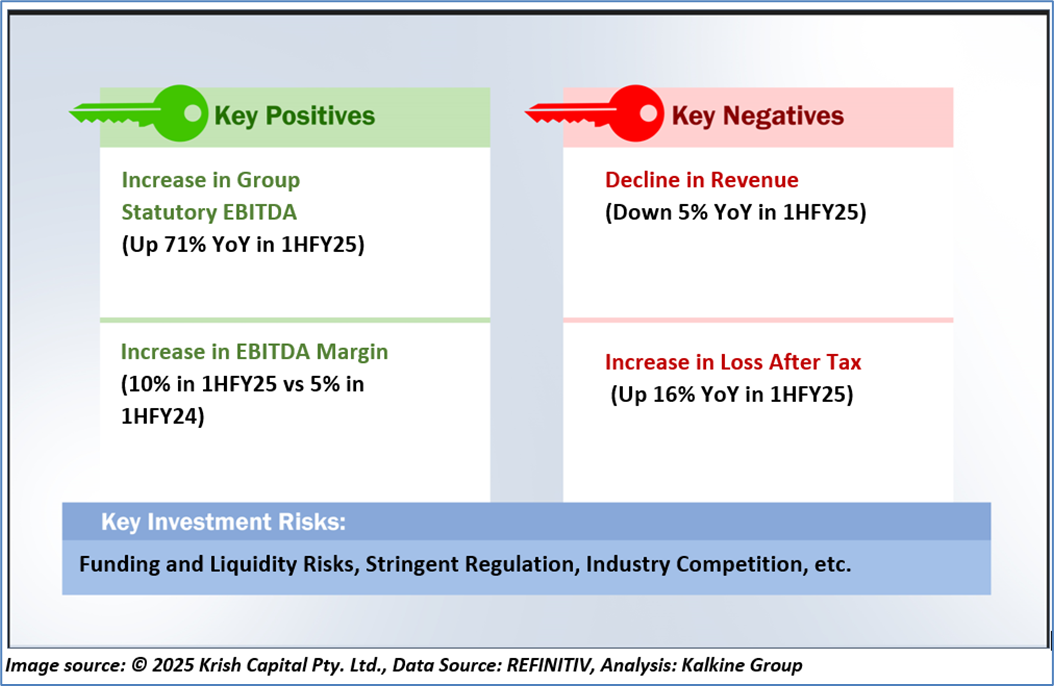
Section 1.0: Key Metrics in Pictures
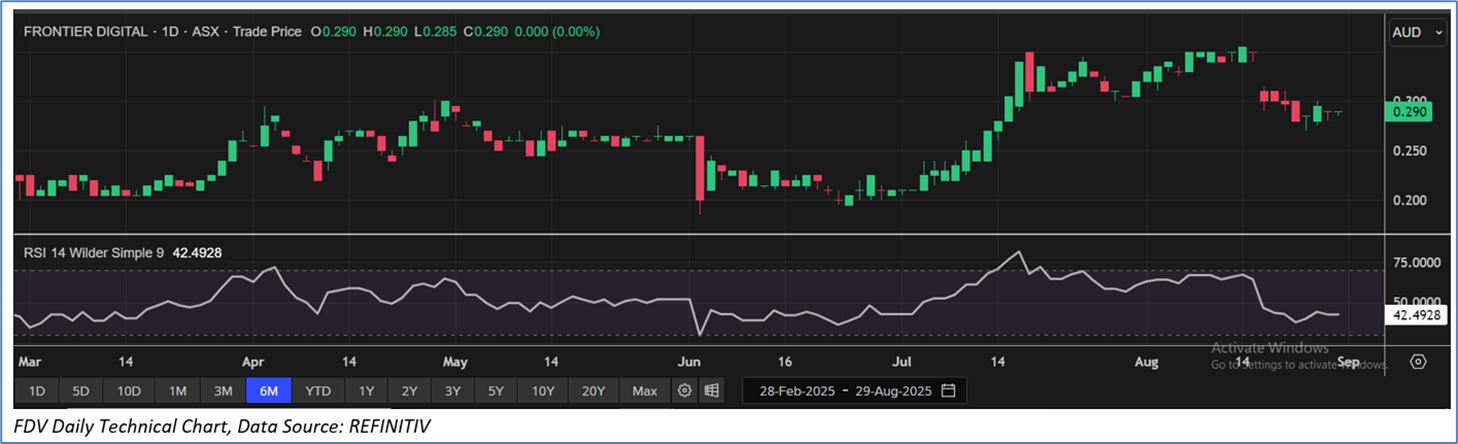
Having looked at the key financial ratios above the below sections provide an in-depth fundamental, and technical analysis on this one ASX-listed Media & Entertainment stock with recommendations, technical support and resistance levels and indicative stop-loss.
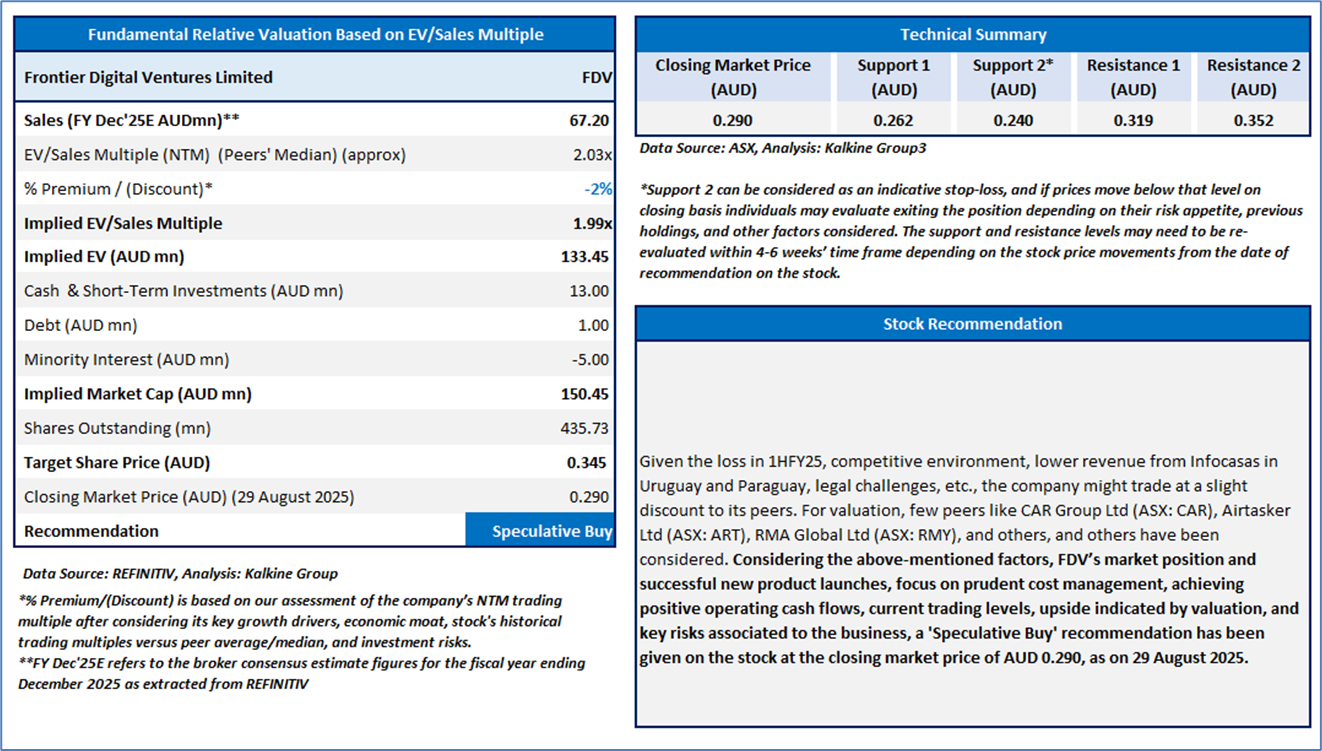
Section 2.0: Frontier Digital Ventures Limited (‘Speculative Buy’ at AUD 0.290 closing market price per share as on 29 August 2025)
2.1 Company Details
2.2 Stock Recommendation and Valuation
The stock has witnessed a dip of ~4.9% in last one month, and over the last one year, it has decreased by ~21.6%. The stock has a 52-week low and 52-week high of AUD 0.185 and AUD 0.515, respectively and is currently trading below the 52-week high-low average. FDV was last covered in a report dated ‘15 July 2025’.
Markets are trading in a highly volatile zone currently due to certain macro-economic issues and geopolitical issues prevailing geopolitical tensions. Therefore, it is prudent to follow a cautious approach while investing.
Note 1: Past performance is neither an indicator nor a guarantee of future performance.
Note 2: The reference date for all price data, currency, technical indicators, support, and resistance levels is 29 August 2025. The reference data in this report has been partly sourced from REFINITIV.
Note 3: Investment decisions should be made depending on an individual's appetite for upside potential, risks, holding duration, and any previous holdings. An 'Exit' from the stock can be considered if the Target Price mentioned as per the Valuation and or the technical levels provided has been achieved and is subject to the factors discussed above.
Note 4: Kalkine reports are prepared based on the stock prices captured either from REFINITIV or Trading View. Typically, REFINITIV or Trading View may reflect stock prices with a delay which could be a lag of 25-30 minutes. There can be no assurance that future results or events will be consistent with the information provided in the report. The information is subject to change without any prior notice.
Note 5: Dividend Yield may vary as per the stock price movement.
Technical Indicators Defined: -
Support: A level at which the stock prices tend to find support if they are falling, and a downtrend may take a pause backed by demand or buying interest. Support 1 refers to the nearby support level for the stock and if the price breaches the level, then Support 2 may act as the crucial support level for the stock.
Resistance: A level at which the stock prices tend to find resistance when they are rising, and an uptrend may take a pause due to profit booking or selling interest. Resistance 1 refers to the nearby resistance level for the stock and if the price surpasses the level, then Resistance 2 may act as the crucial resistance level for the stock.
Stop-loss: It is a level to protect further losses in case of unfavourable movement in the stock prices.

 Please wait processing your request...