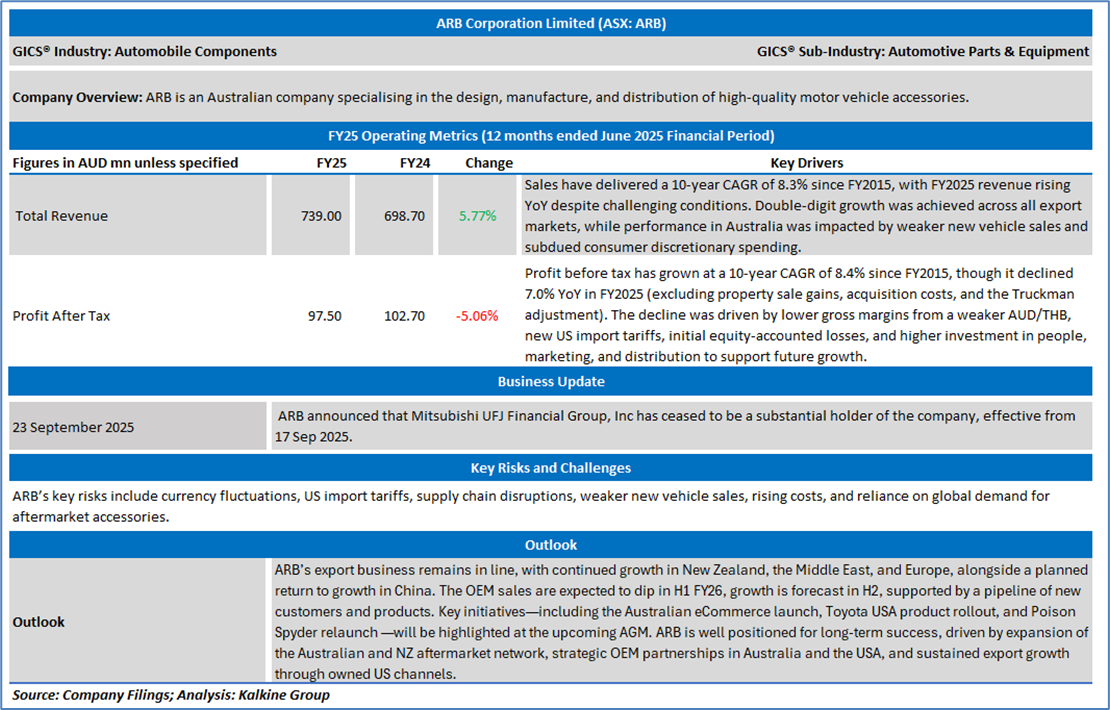
Company Overview: ARB Corporation Ltd (ASX: ARB) is an Australian company specialising in the design, manufacture, and distribution of high-quality motor vehicle accessories. The company offers a wide range of products, including bull bars, suspension systems, and roof racks, catering to the off-road and 4WD vehicle markets. Calix Limited (ASX: CXL) is an Australia-based environmental technology company engaged in solving global challenges in industrial decarbonization and sustainability. Its segments include Leilac (a CO2 mitigation business), Sustainable Processing, Advanced Batteries and Magnesia. Kalkine’s Daily Report covers the Key Financial Metrics, Risks, Outlook, Technical Analysis along with the Valuation, Target Price, and Recommendation on the stock.
ARB Corporation Ltd (ASX: ARB)
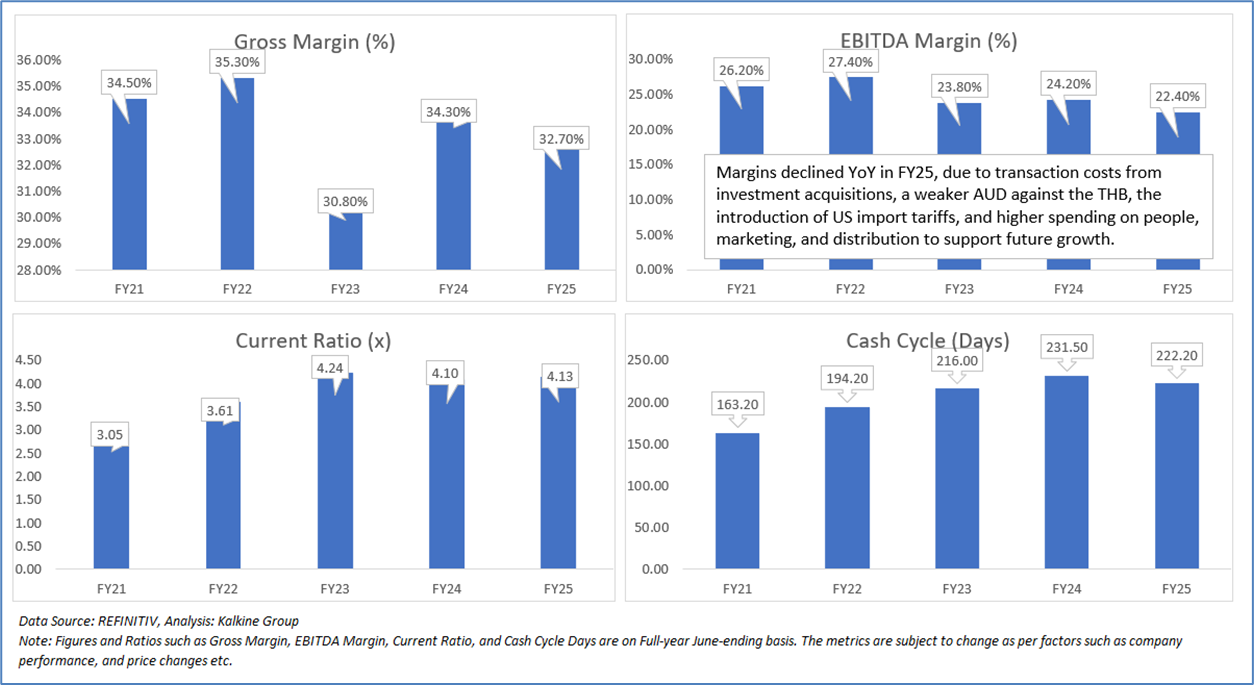
Section 1.0: Key Metrics in Pictures
Having looked at the key financial ratios above, the below sections provide an in-depth fundamental and technical analysis on this one ASX-listed automobiles & components stock with recommendations, technical support and resistance levels and indicative stop-loss.
Section 2.0: ARB Corporation Ltd (ASX: ARB) (‘Buy’ at AUD 38.560, closing market price per share as on 30 September 2025)
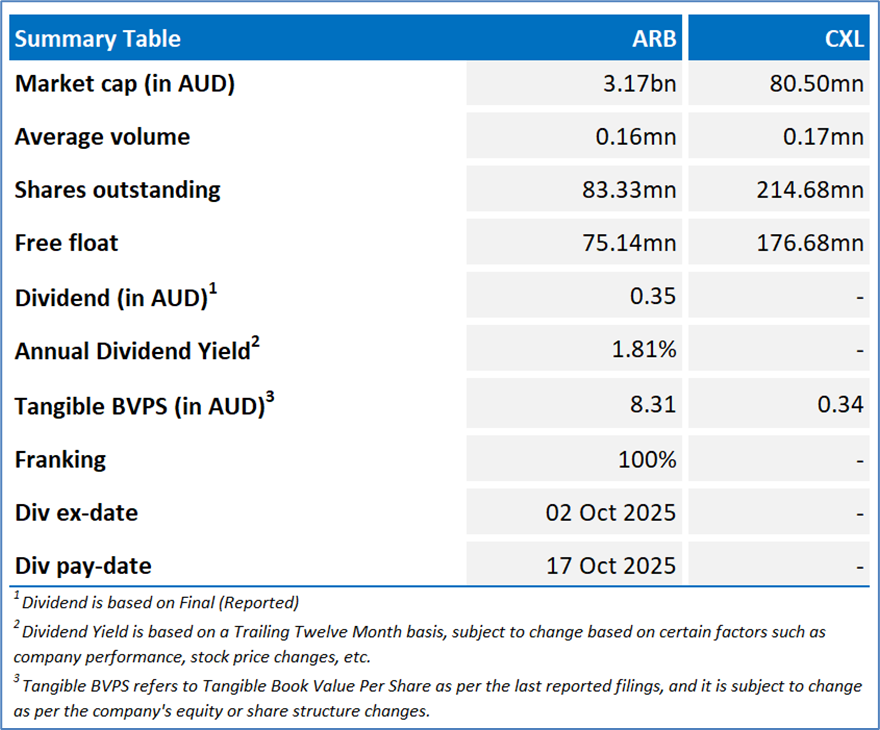
2.1 Company Details
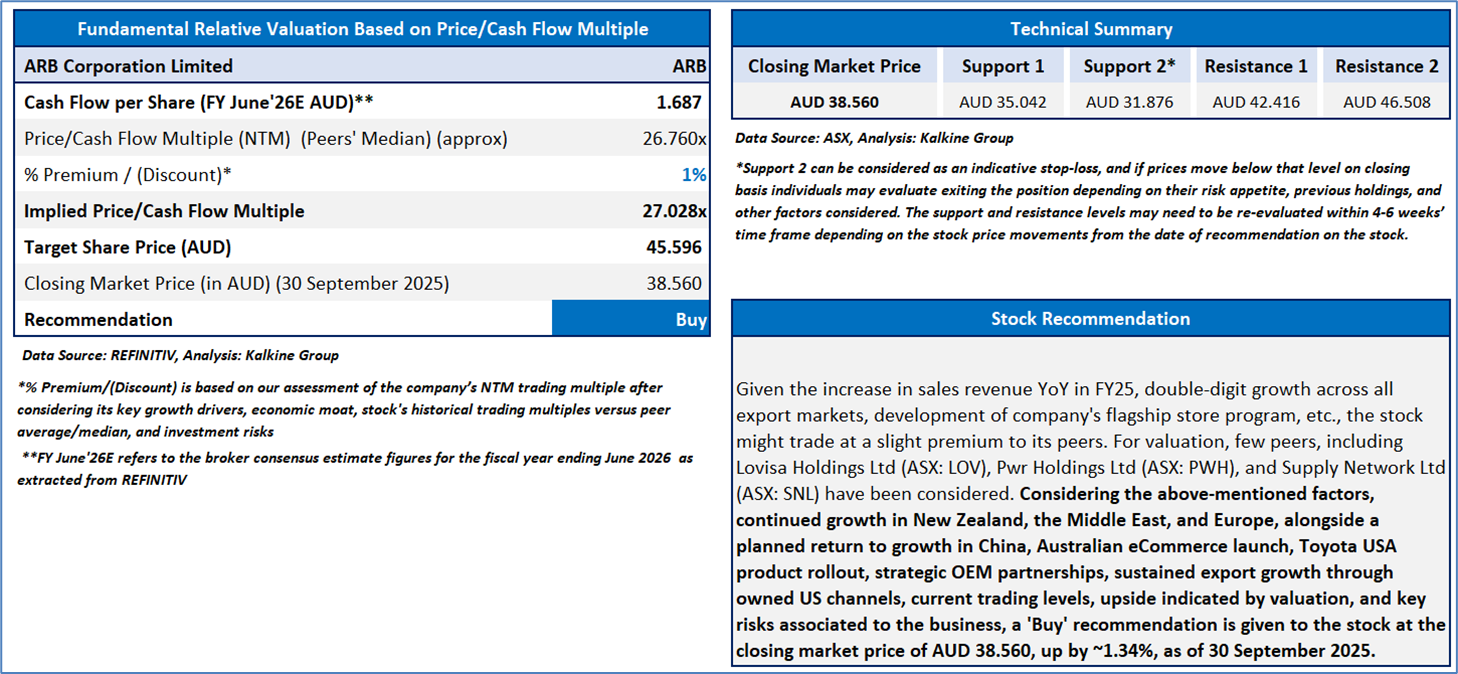
2.2 Stock Recommendation and Valuation
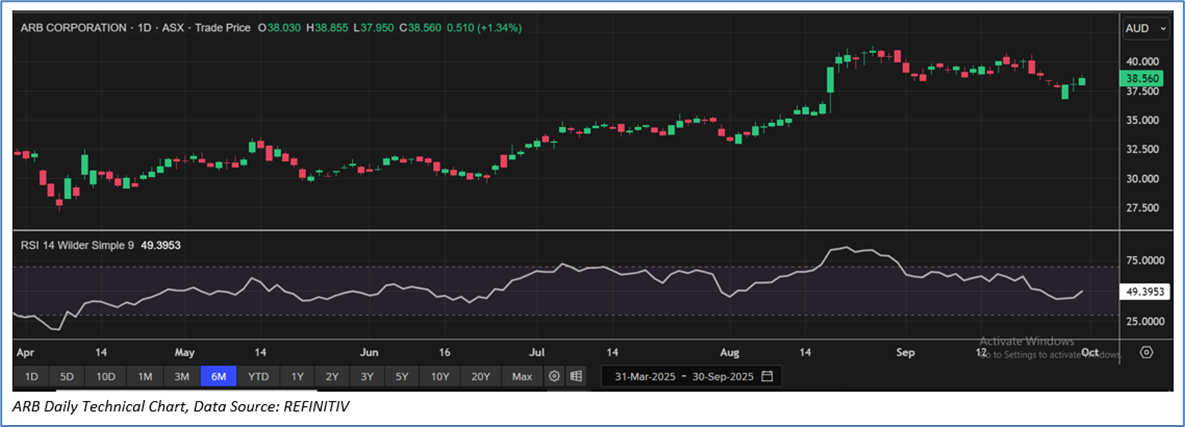
The stock has witnessed a rise of ~16.1% in the last three months, whereas over the last nine months, it has decreased by ~5.04%. The stock has a 52-week low and 52-week high of AUD 27.15 and AUD 48.11, respectively and is currently trading above the 52-week high-low average. ARB was last covered in a report dated ’13 August 2025’.
Calix Limited (ASX: CXL)
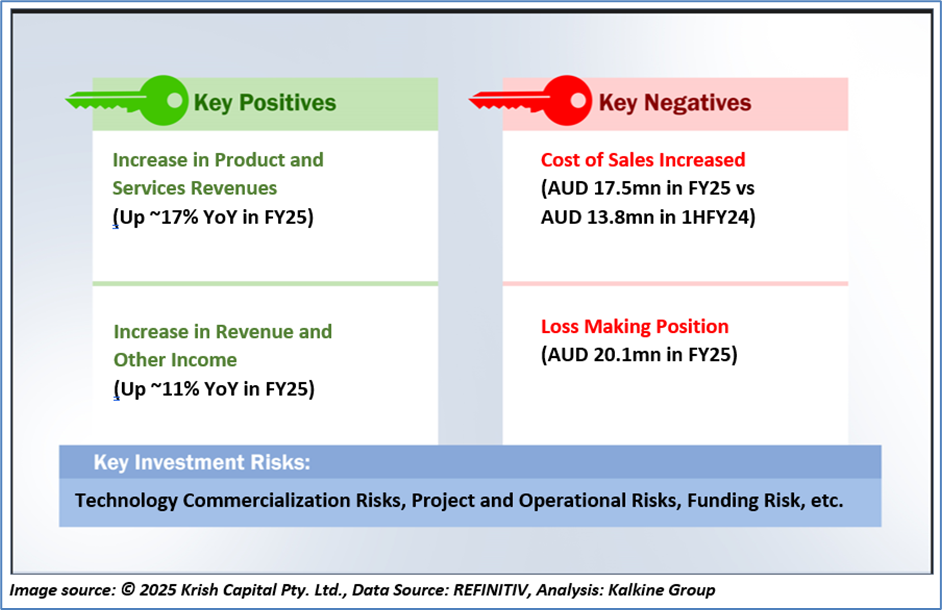
Section 3.0: Key Metrics in Pictures
Having looked at the key financial ratios above, the below sections provide an in-depth fundamental and technical analysis on this one ASX-listed chemicals stock with recommendations, technical support and resistance levels and indicative stop-loss.
Section 4.0: Calix Limited (ASX: CXL) (‘Speculative Buy’ at AUD 0.410, closing market price per share as on 30 September 2025)
4.1 Company Details
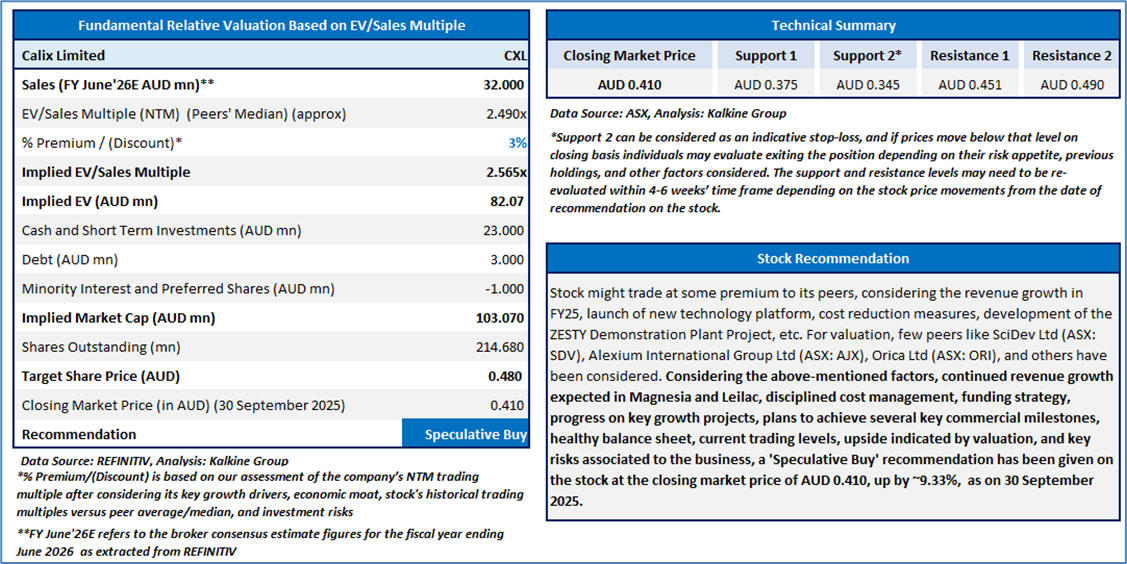
4.2 Stock Recommendation and Valuation
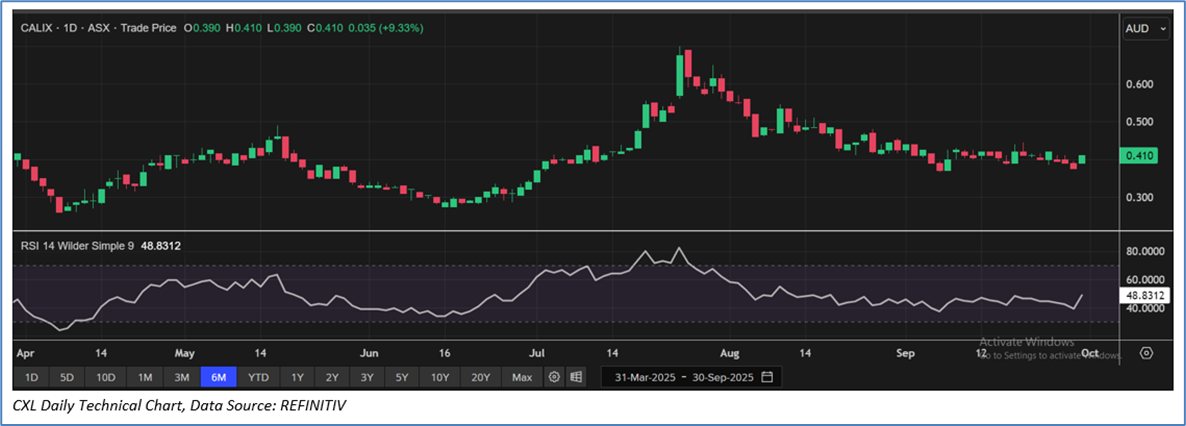
The stock has witnessed a rise of ~10.8% in the last three months, whereas over the last nine months, it has decreased by ~45.3%. The stock has a 52-week low and 52-week high of AUD 0.260 and AUD 1.295, respectively and is currently trading below the 52-week high-low average. CXL was last covered in a report dated ’05 September 2025’.
Markets are trading in a highly volatile zone currently due to certain macro-economic and geopolitical tensions prevailing. Therefore, it is prudent to follow a cautious approach while investing.
Note 1: Past performance is neither an indicator nor a guarantee of future performance.
Note 2: The reference date for all price data, currency, technical indicators, support, and resistance levels is 30 September 2025. The reference data in this report has been partly sourced from REFINITIV.
Note 3: Investment decisions should be made depending on an individual's appetite for upside potential, risks, holding duration, and any previous holdings. An 'Exit' from the stock can be considered if the Target Price mentioned as per the Valuation and or the technical levels provided has been achieved and is subject to the factors discussed above.
Note 4: Kalkine reports are prepared based on the stock prices captured either from REFINITIV or Trading View. Typically, REFINITIV or Trading View may reflect stock prices with a delay which could be a lag of 25-30 minutes. There can be no assurance that future results or events will be consistent with the information provided in the report. The information is subject to change without any prior notice.
Note 5: Dividend Yield may vary as per the stock price movement.
Technical Indicators Defined: -
Support: A level at which the stock prices tend to find support if they are falling, and a downtrend may take a pause backed by demand or buying interest. Support 1 refers to the nearby support level for the stock and if the price breaches the level, then Support 2 may act as the crucial support level for the stock.
Resistance: A level at which the stock prices tend to find resistance when they are rising, and an uptrend may take a pause due to profit booking or selling interest. Resistance 1 refers to the nearby resistance level for the stock and if the price surpasses the level, then Resistance 2 may act as the crucial resistance level for the stock.
Stop-loss: It is a level to protect further losses in case of unfavourable movement in the stock prices.

 Please wait processing your request...