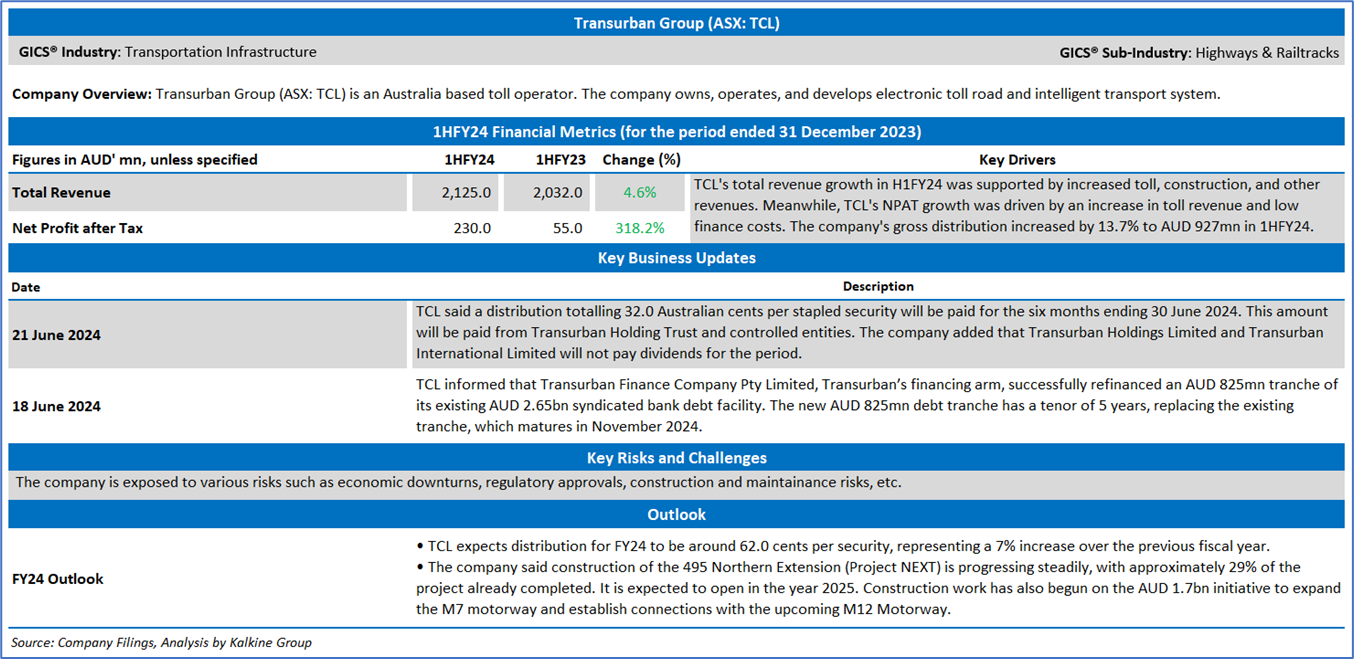
Company Overview: Transurban Group (ASX: TCL) is an Australia based toll operator. The company owns, operates, and develops electronic toll road and intelligent transport system. Champion Iron Limited (ASX: CIA) is an ASX listed iron ore exploration and development entity with major projects in the Southern Labrador Trough, Canada’s largest source of iron ore. Kalkine’s Daily Report covers the Key Financial Metrics, Risks, Outlook, Technical Analysis along with the Valuation, Target Price, and Recommendation on the stock.
Transurban Group (ASX: TCL)
Section 1.0: Key Metrics in Pictures
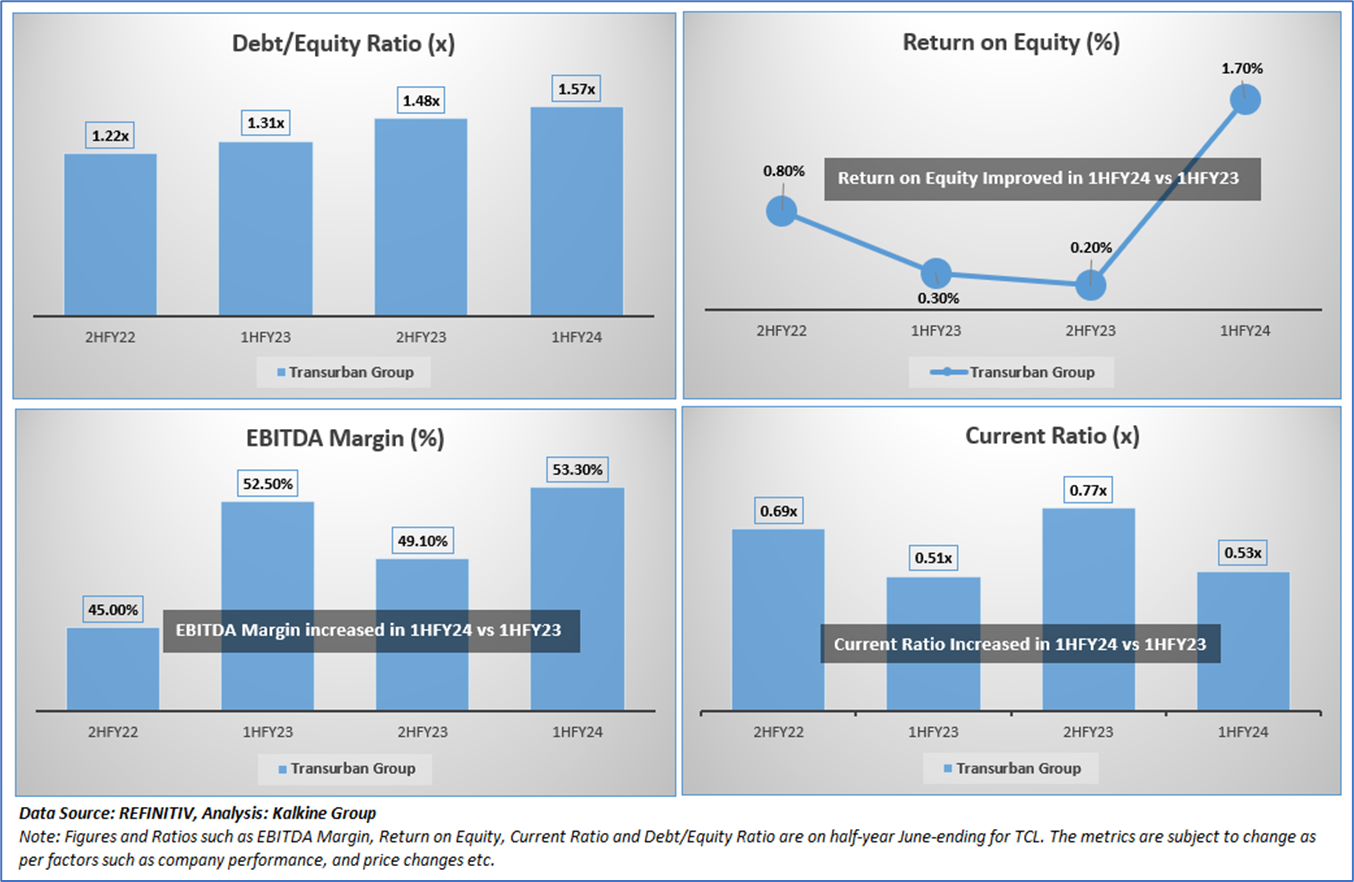
Having looked at the key financial ratios above the below sections provide an in-depth fundamental, and technical analysis on this Industrials stock along with recommendations, technical support and resistance levels and indicative stop-loss.
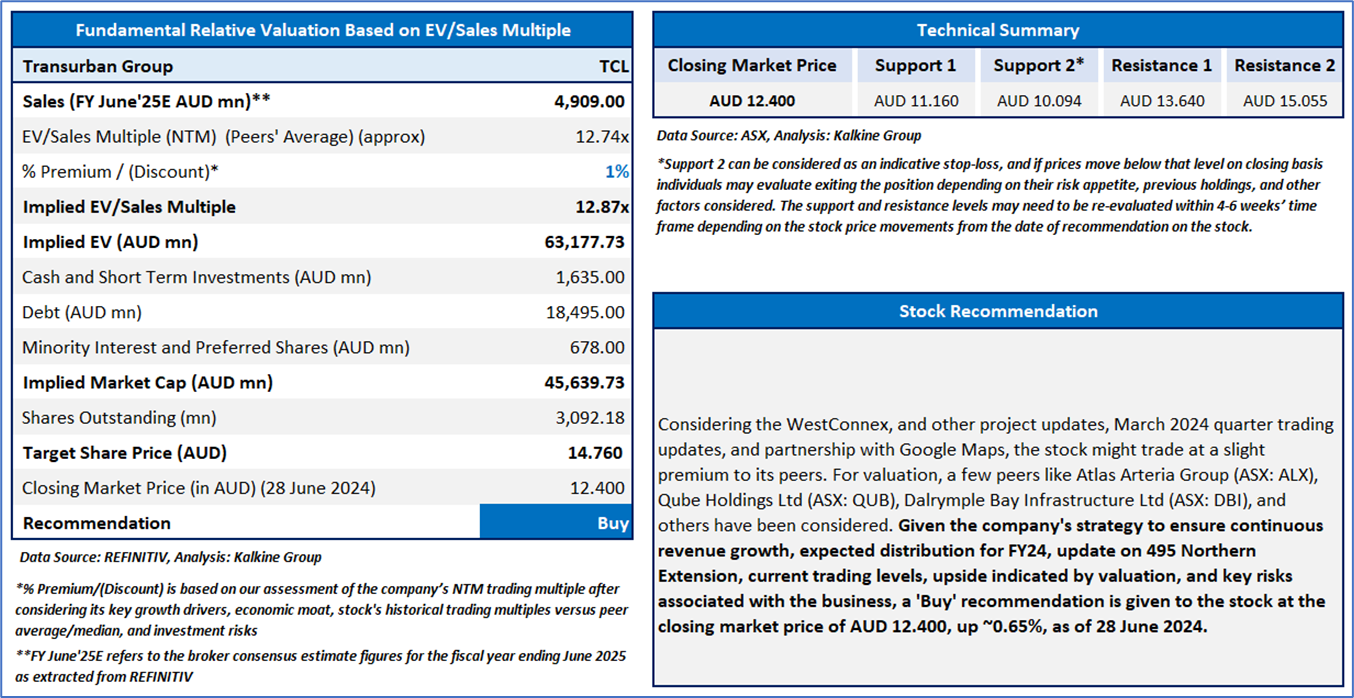
Section 2.0: Transurban Group (‘Buy’ at AUD 12.400, closing market price as on 28 June 2024)
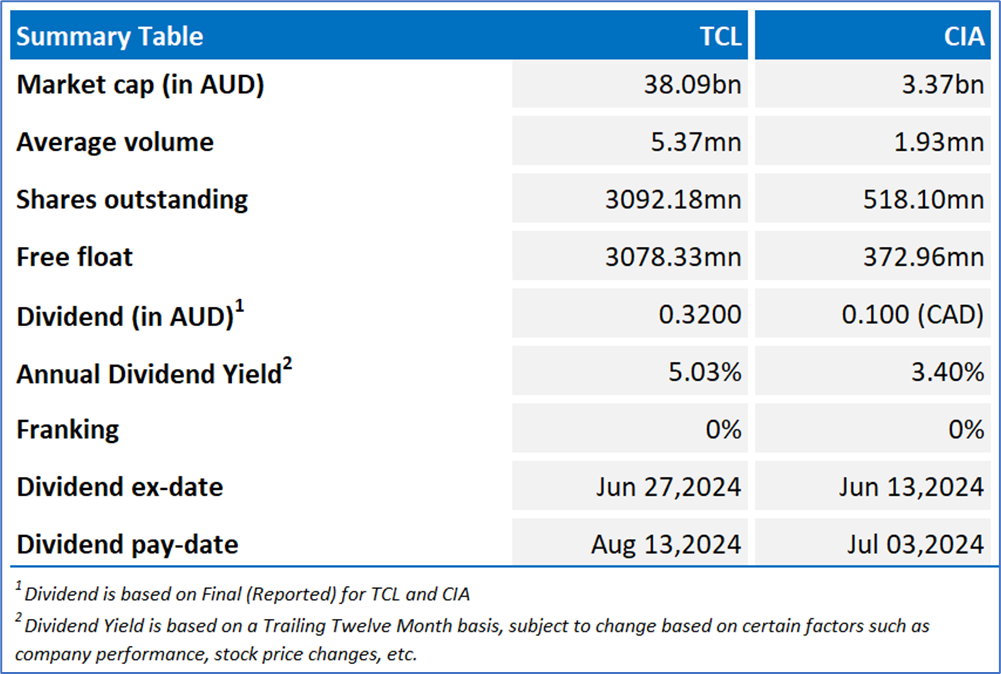
2.1 Company Details
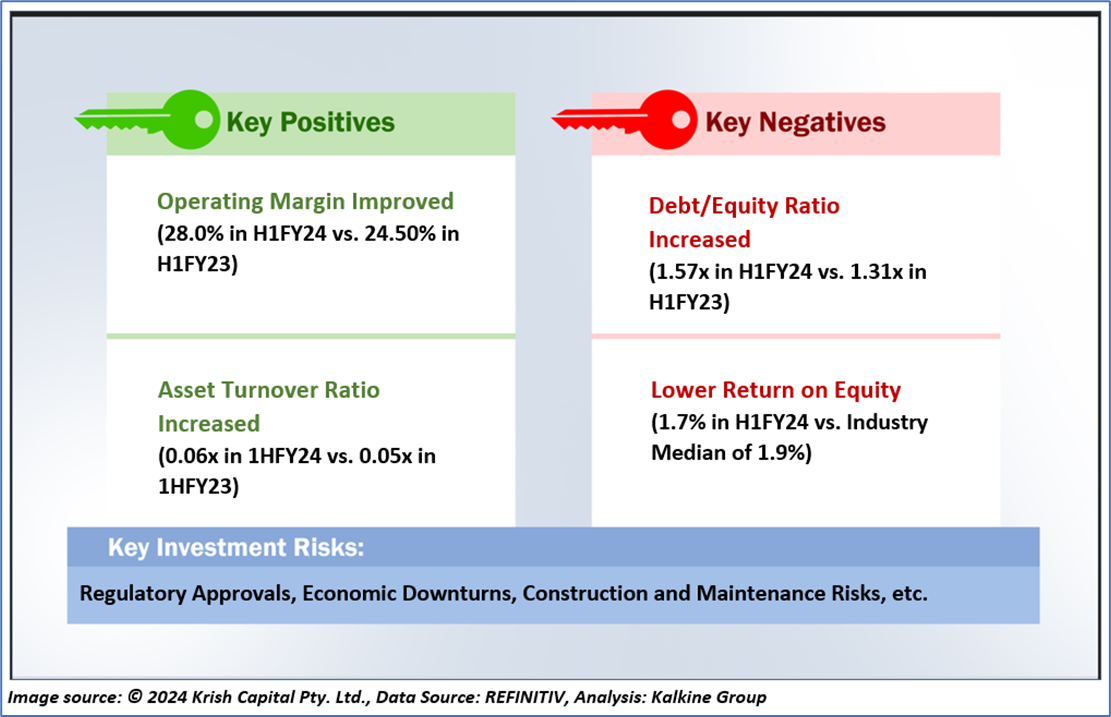
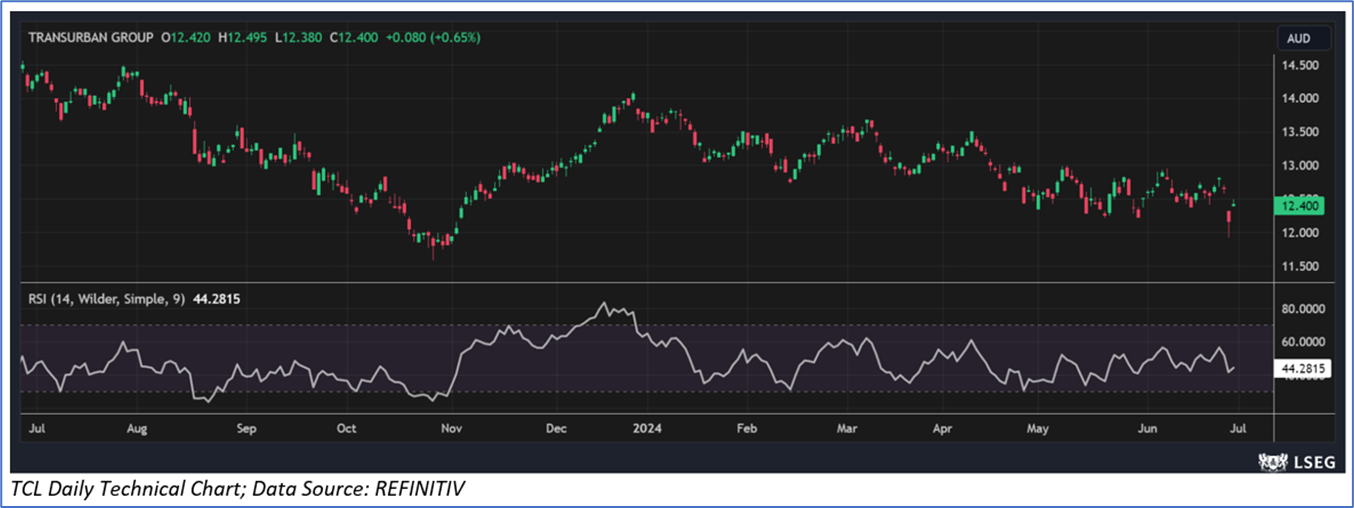
2.2 Stock Recommendation, and Technical Guidance
The stock has witnessed a fall of ~6.91% in 3 months and over the last 6 months, it has declined by ~9.56%. The stock has a 52-week low and 52-week high of AUD 11.580 and AUD 14.560, respectively and is currently trading below the average of 52-week high-low average. TCL was last covered in a report dated ‘29 April 2024’.
Champion Iron Limited (ASX: CIA)
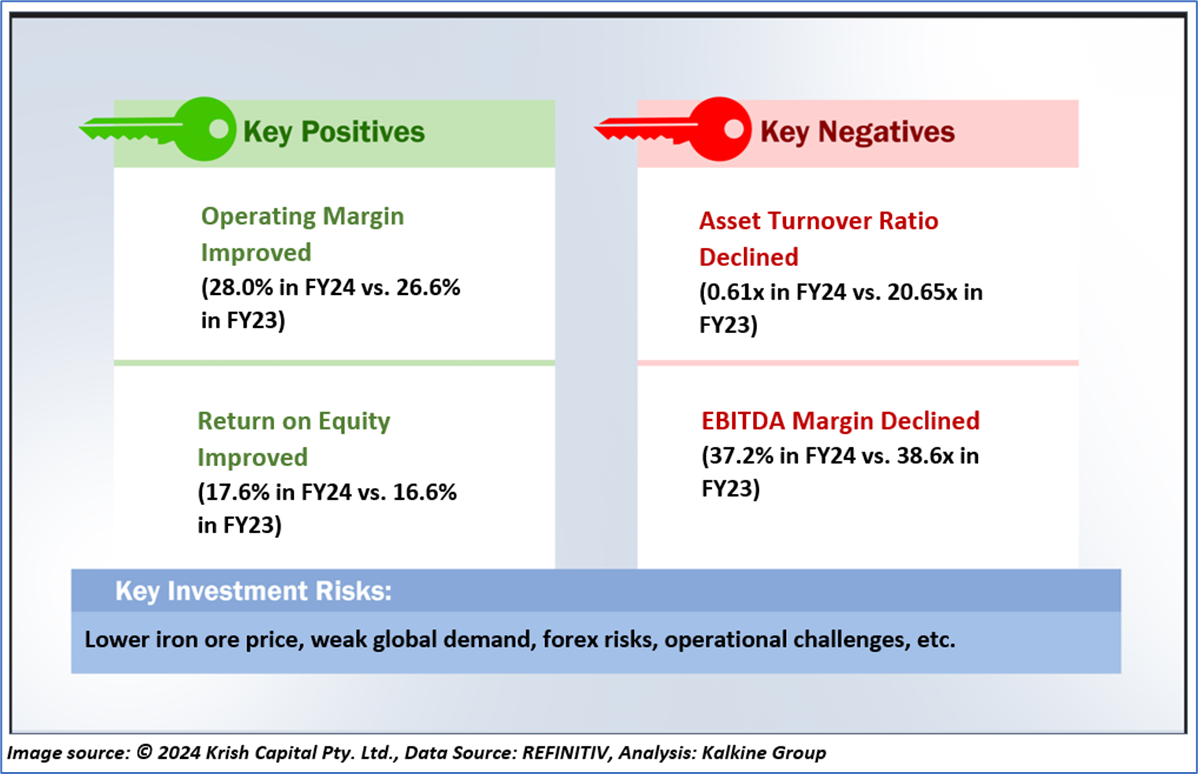
Section 1.0: Key Metrics in Pictures
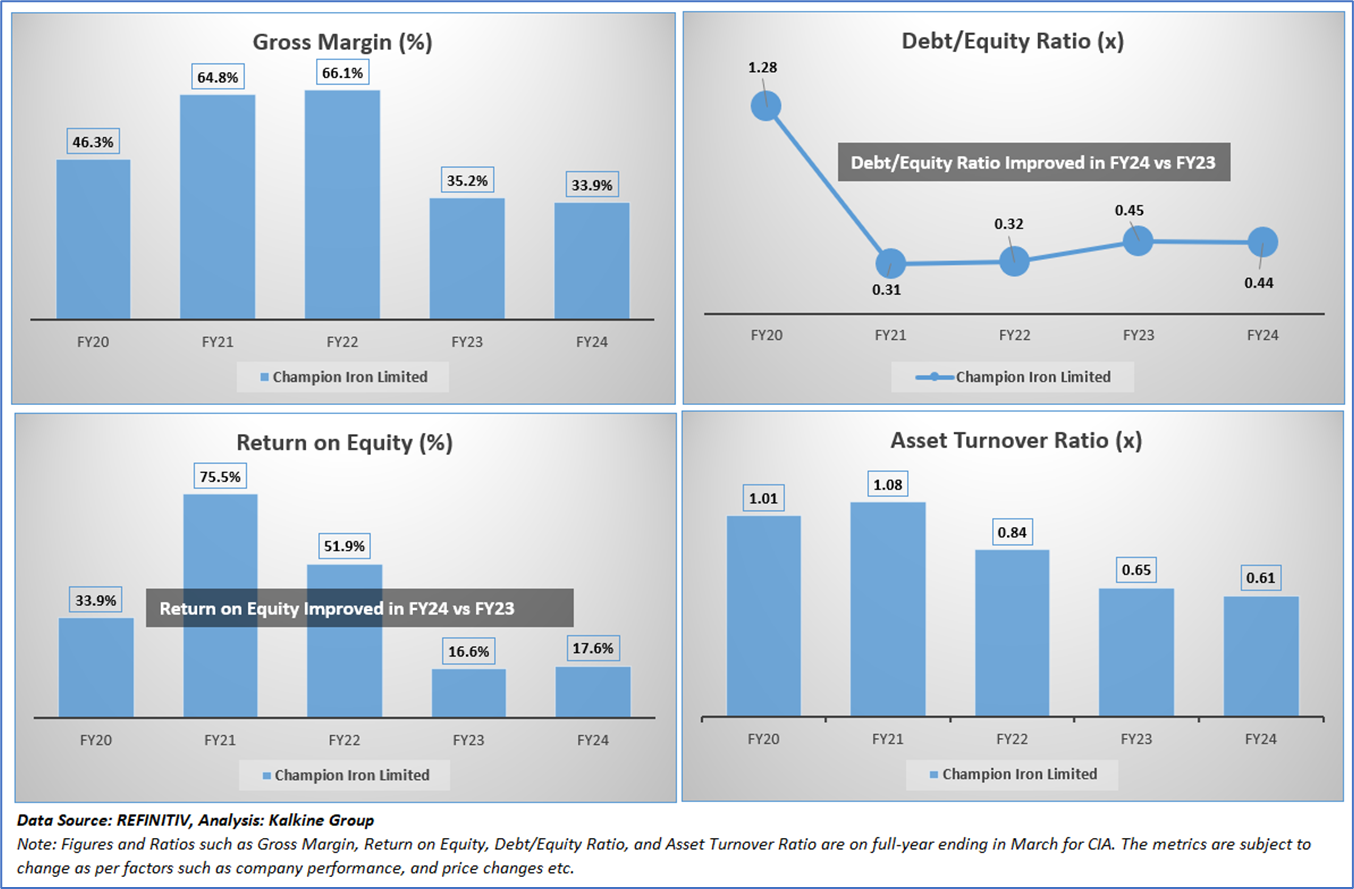
Having looked at the key financial ratios above the below sections provide an in-depth fundamental, and technical analysis on this Materials stock along with recommendations, technical support and resistance levels and indicative stop-loss.
Section 2.0: Champion Iron Limited (‘Speculative Buy’ at AUD 6.400, closing market price as on 28 June 2024)
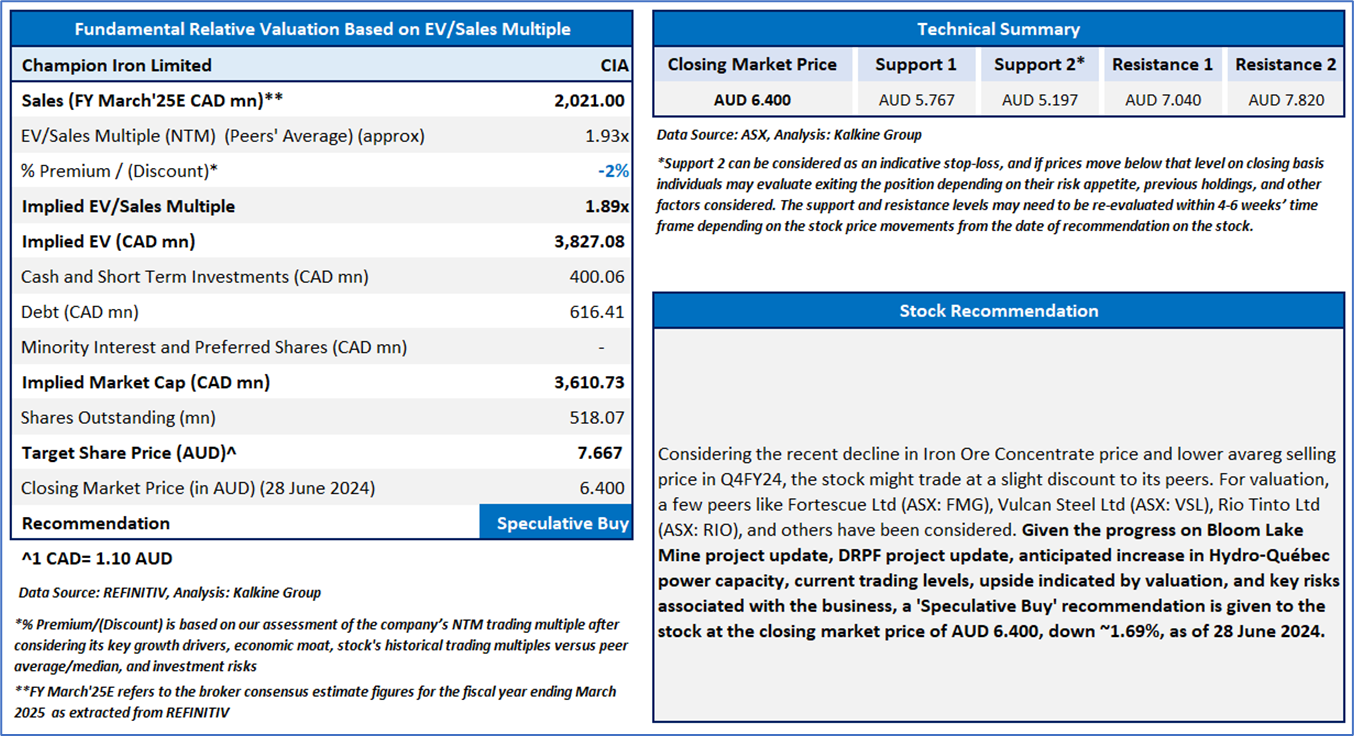
2.1 Company Details
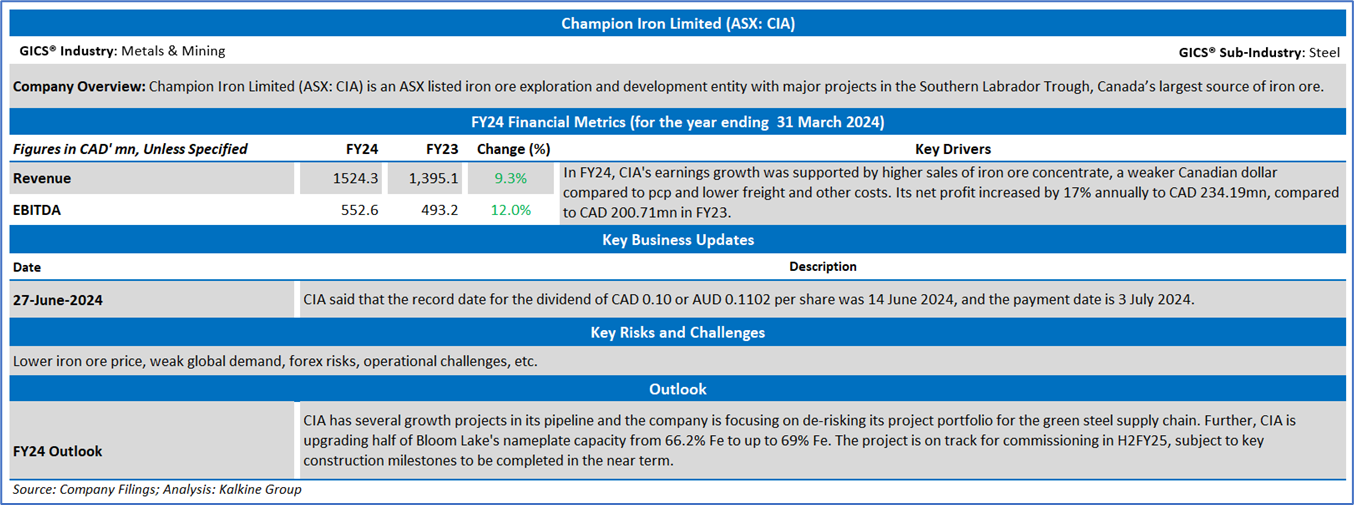
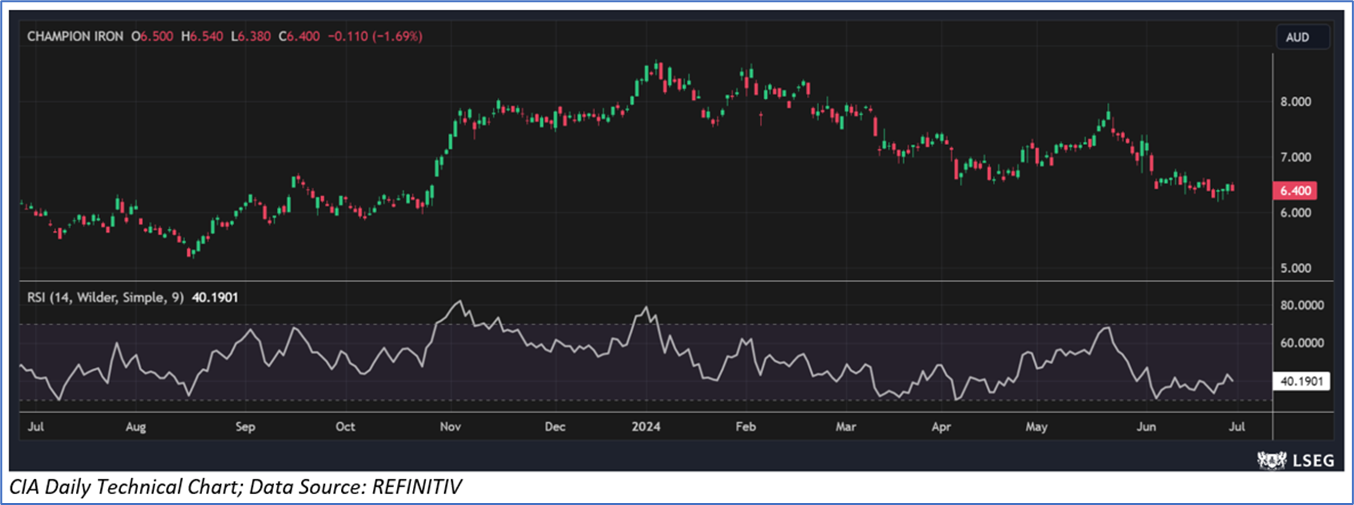
2.2 Stock Recommendation, and Technical Guidance
The stock has witnessed a fall of ~13.63% in 3 months and over the last 6 months, it has declined by ~23.72%. The stock has a 52-week low and 52-week high of AUD 5.165 and AUD 8.750, respectively and is currently trading below its 52-week low. CIA was last covered in a report dated ’13 June 2024’.
Markets are trading in a highly volatile zone currently due to certain macro-economic and geopolitical tensions prevailing. Therefore, it is prudent to follow a cautious approach while investing.
Note 1: Past performance is not a reliable indicator of future performance.
Note 2: The reference date for all price data, currency, technical indicators, support, and resistance levels is 28 June 2024. The reference data in this report has been partly sourced from REFINITIV.
Note 3: Investment decisions should be made depending on an individual's appetite for upside potential, risks, holding duration, and any previous holdings. An 'Exit' from the stock can be considered if the Target Price mentioned as per the Valuation and or the technical levels provided has been achieved and is subject to the factors discussed above.
Note 4: Dividend Yield may vary as per the stock price movement.
Technical Indicators Defined: -
Support: A level at which the stock prices tend to find support if they are falling, and a downtrend may take a pause backed by demand or buying interest. Support 1 refers to the nearby support level for the stock and if the price breaches the level, then Support 2 may act as the crucial support level for the stock.
Resistance: A level at which the stock prices tend to find resistance when they are rising, and an uptrend may take a pause due to profit booking or selling interest. Resistance 1 refers to the nearby resistance level for the stock and if the price surpasses the level, then Resistance 2 may act as the crucial resistance level for the stock.
Stop-loss: It is a level to protect further losses in case of unfavourable movement in the stock prices.

 Please wait processing your request...