
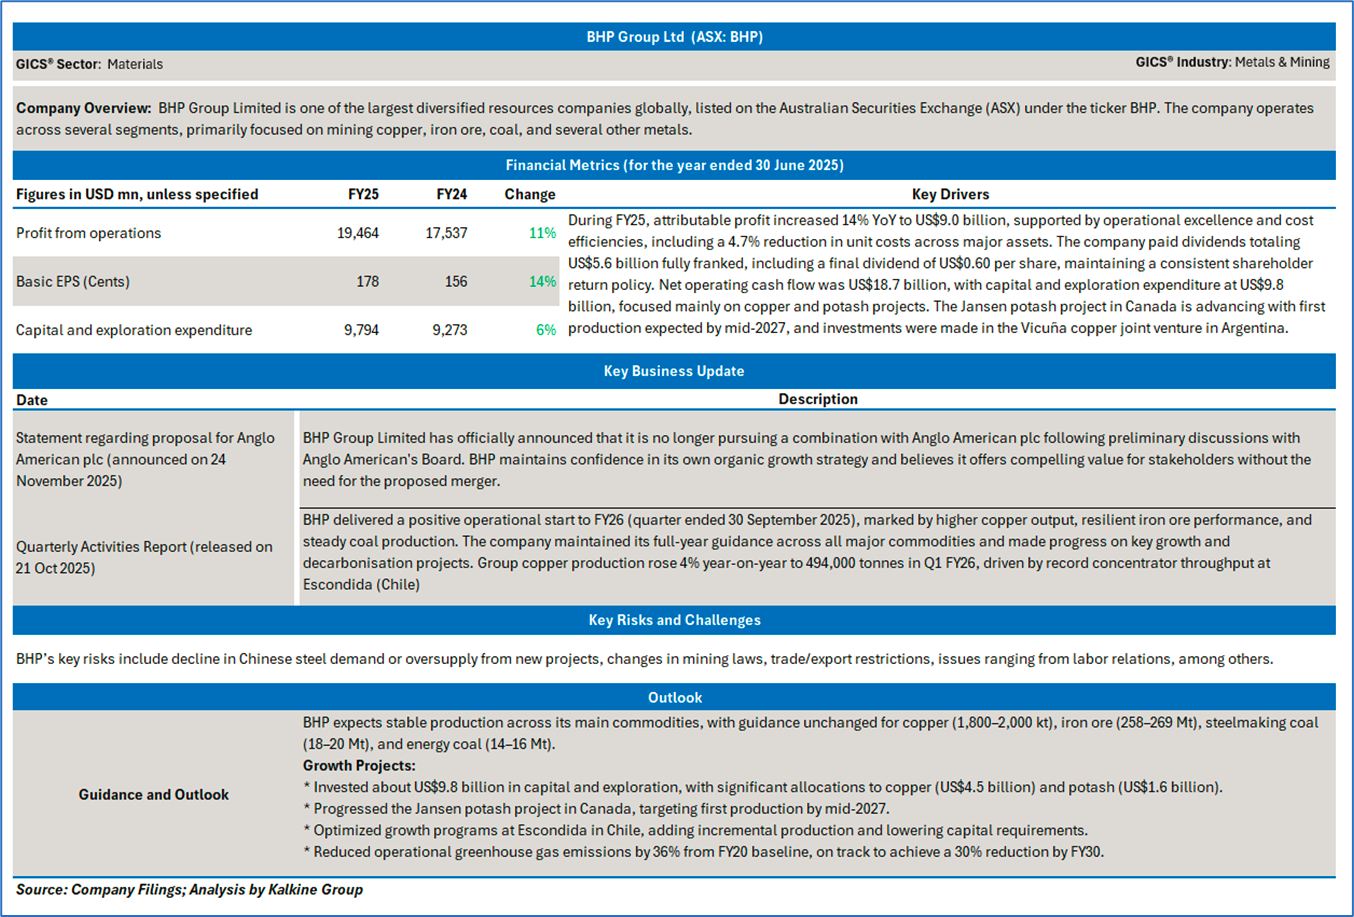
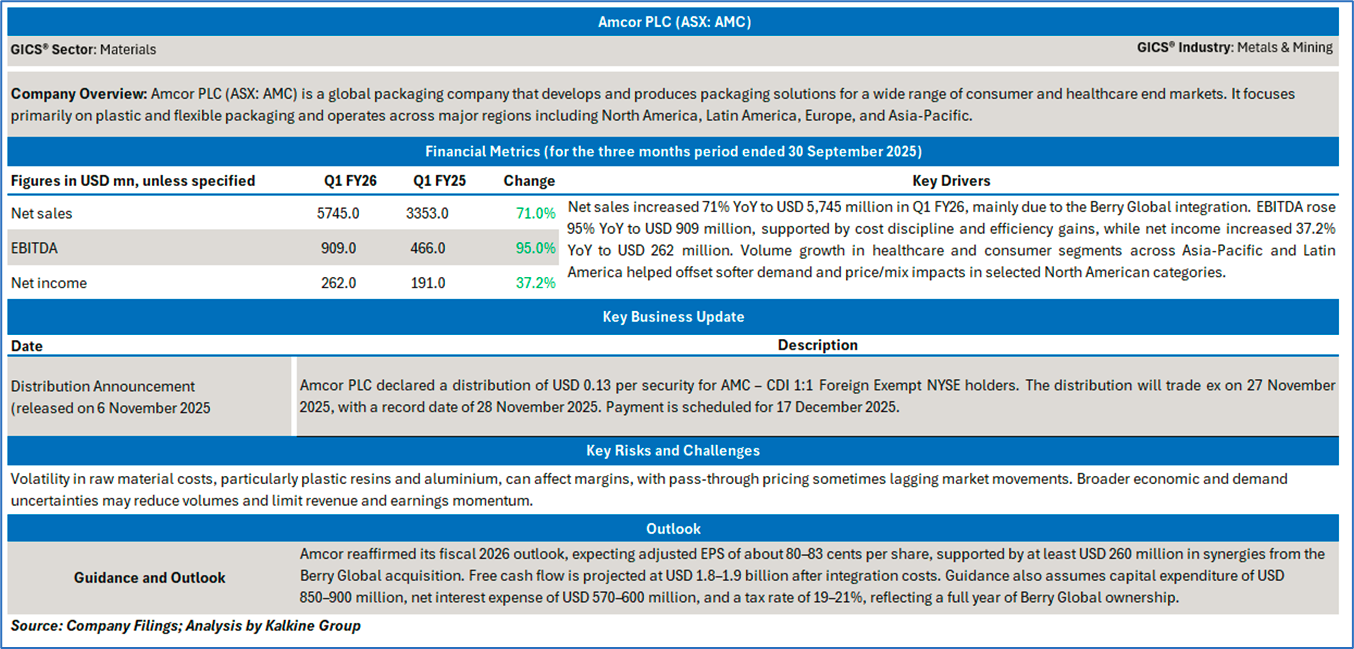
Company Overview: BHP Group Ltd (ASX: BHP) is a diversified resources company and sector leader in the production of iron ore, copper, coal, and emerging future-facing commodities such as potash. For the year ended 30 June 2025, BHP delivered record operational metrics, including over 2 Mt copper and 263 Mt iron ore, supported by disciplined capital allocation and operational excellence. The company maintained a world-leading cost position in iron ore at Western Australia Iron Ore. Amcor PLC (ASX: AMC) is a global packaging company that develops and produces packaging solutions for a wide range of consumer and healthcare end markets. It focuses primarily on plastic and flexible packaging and operates across major regions including North America, Latin America, Europe, and Asia-Pacific. Kalkine’s Daily Report covers the Key Financial Metrics, Risks, Outlook, Technical Analysis along with the Valuation, Target Price, and Recommendation on the stock.
BHP Group Ltd (ASX: BHP)
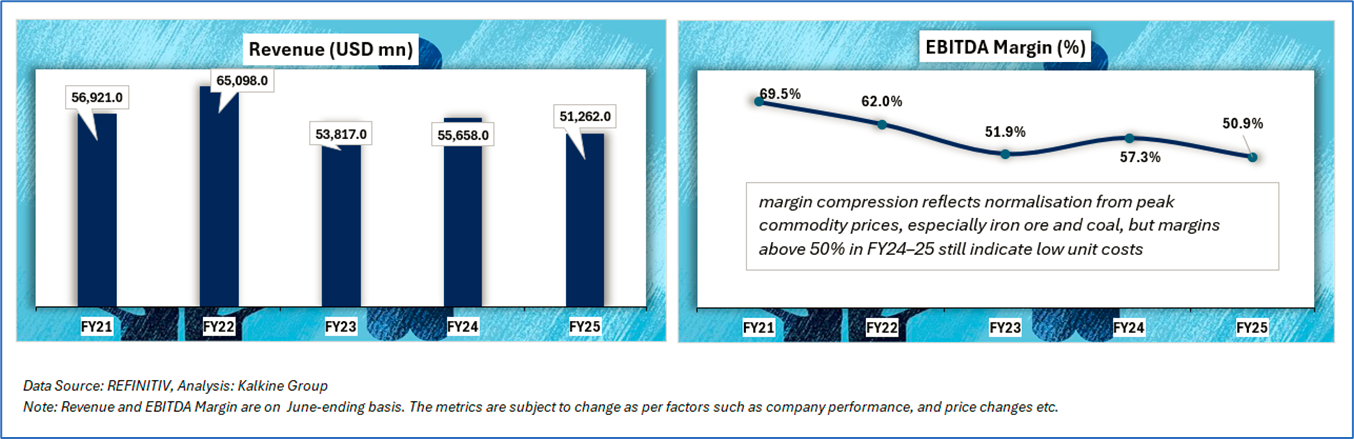
Section 1.0: Key Metrics in Pictures
Having looked at the key financial ratios above the below sections provide an in-depth fundamental, and technical analysis on this Materials’ stock along with recommendations, technical support and resistance levels and indicative stop-loss.
Section 2.0: BHP Group Ltd (ASX: BHP) (‘Buy’ at AUD 41.670, Closing Market Price as on 28 November 2025)
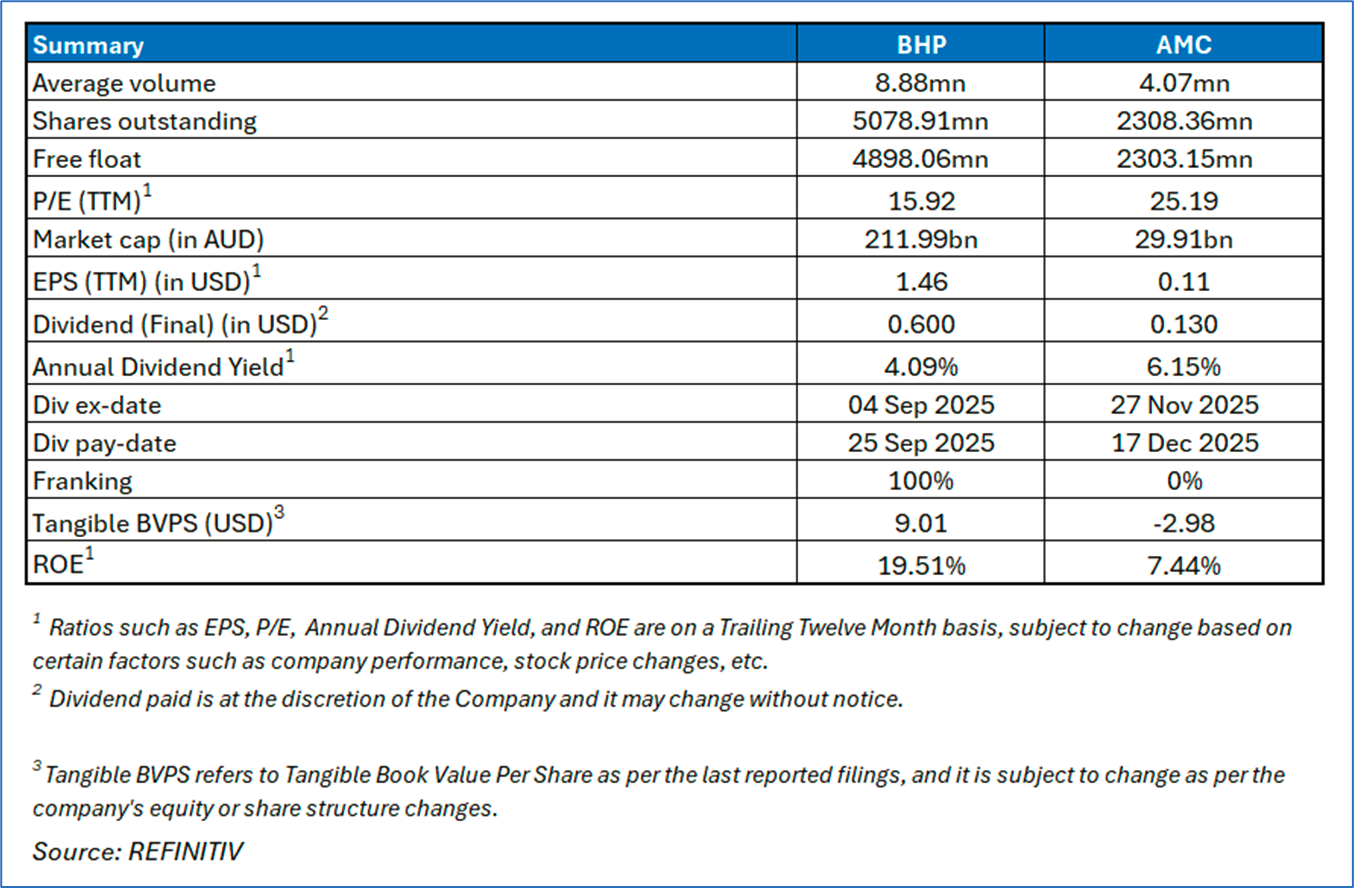
2.1 Company Details
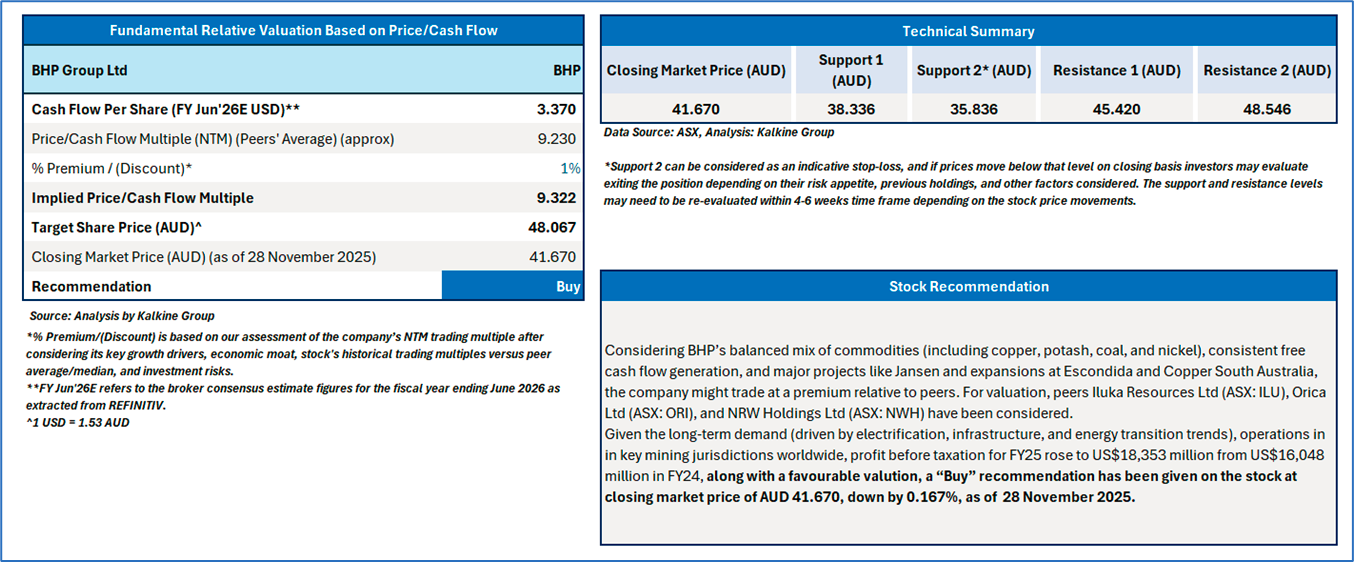
2.2 Valuation, Stock Recommendation, and Technical Guidance
The stock has declined by ~3.85% in the last 1 month and over the last 1 year, it has gained by ~3.89%. The stock has a 52-week low and 52-week high of AUD 33.250 and AUD 44.550, respectively and is currently trading above its 52-week high and low average. BHP was previously covered in a report dated ’13 October 2025’.
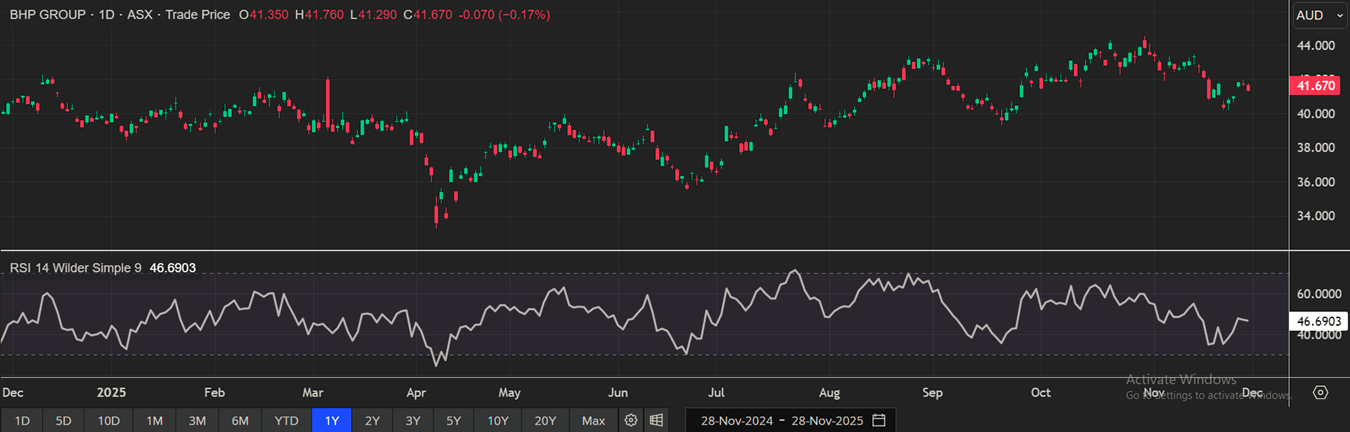
(Source: REFINTIV; Analysis by Kalkine Group)
Amcor PLC (ASX: AMC)
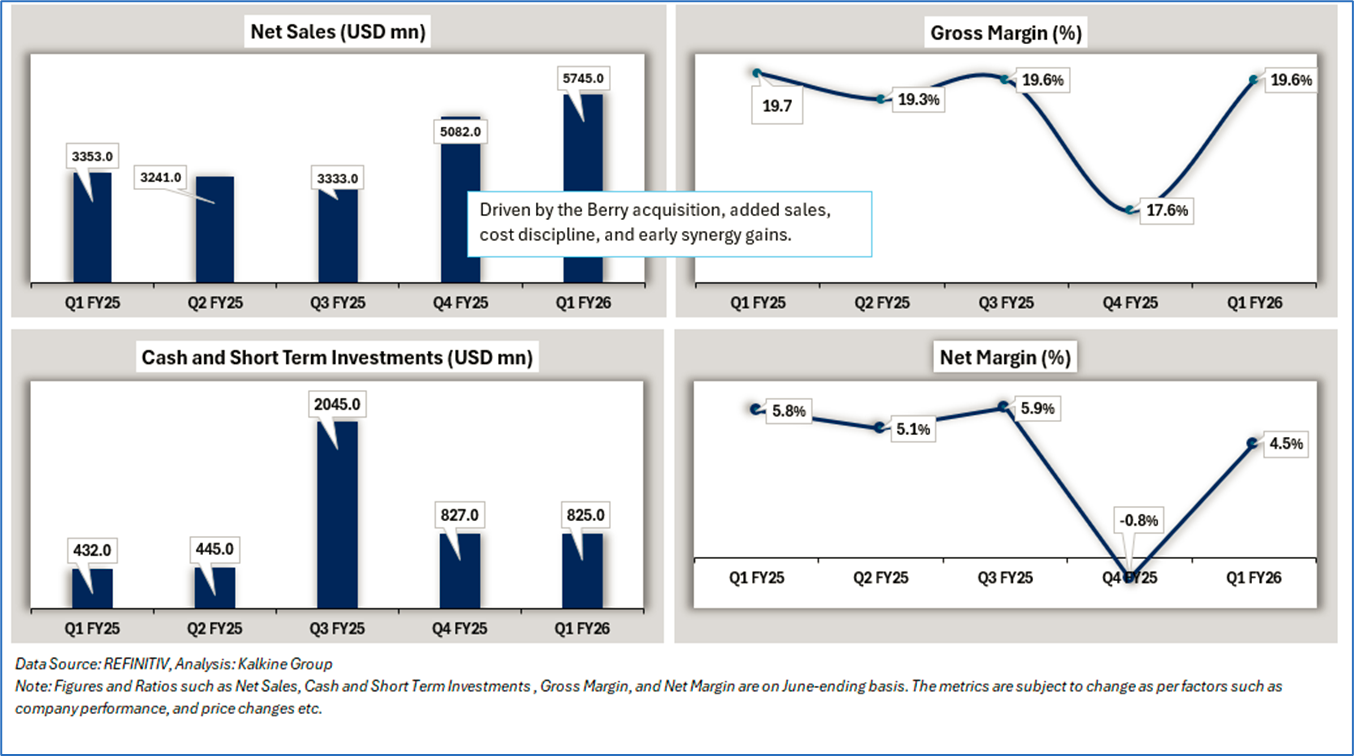
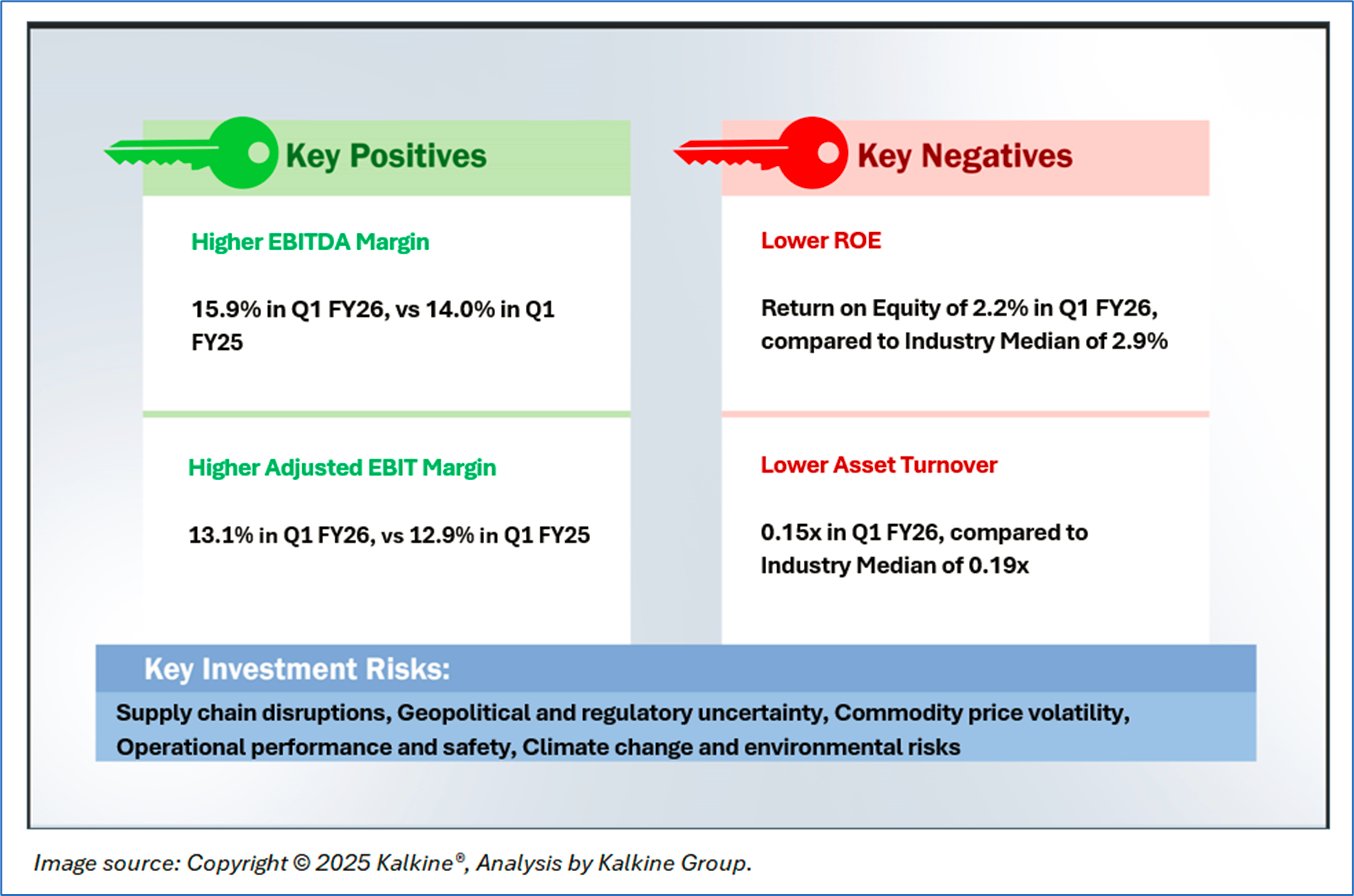
Section 1.0: Key Metrics in Pictures
Having looked at the key financial ratios above the below sections provide an in-depth fundamental, and technical analysis on this Materials’ stock along with recommendations, technical support and resistance levels and indicative stop-loss.
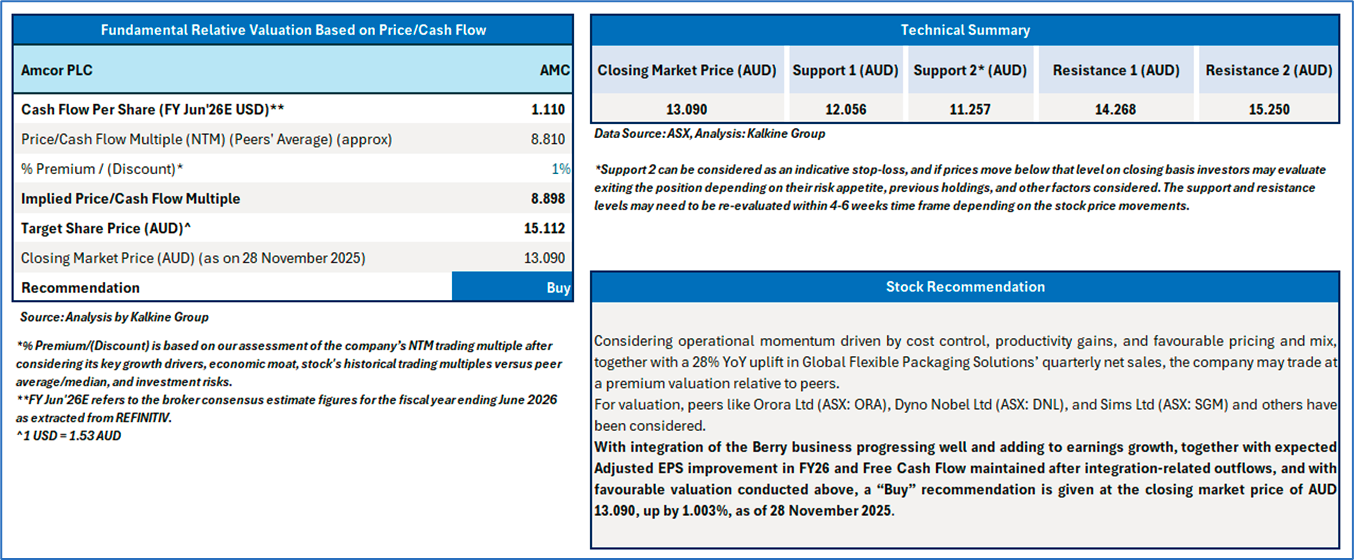
Section 2.0: Amcor PLC (ASX: AMC) (‘Buy’ at AUD 13.090, Closing Market Price as on 28 November 2025)
2.3 Company Details
2.4 Valuation, Stock Recommendation, and Technical Guidance
The stock has gained by ~3.81% in the last 1 month and over the last 1 year, it has corrected by ~20.33%. The stock has a 52-week low and 52-week high of AUD 11.970 and AUD 16.580, respectively and is currently trading below its 52-week high and low average. AMC was previously covered in a report dated ’29 September 2025’.
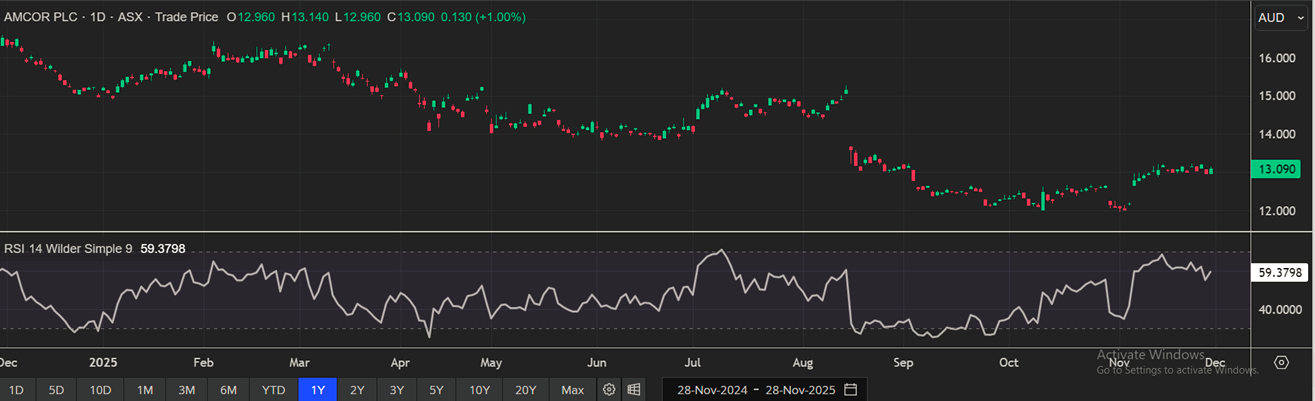
(Source: REFINTIV; Analysis by Kalkine Group)
Note 1: Past performance is not a reliable indicator of future performance.
Note 2: The reference date for all price data, currency, technical indicators, support, and resistance levels is 28 November 2025. The reference data in this report has been partly sourced from REFINITIV.
Note 3: Investment decisions should be made depending on an individual's appetite for upside potential, risks, holding duration, and any previous holdings. An 'Exit' from the stock can be considered if the Target Price mentioned as per the Valuation and or the technical levels provided has been achieved and is subject to the factors discussed above.
Note 4: Kalkine reports are prepared based on the stock prices captured either from REFINITIV or Trading View. Typically, REFINITIV or Trading View may reflect stock prices with a delay which could be a lag of 25-30 minutes. There can be no assurance that future results or events will be consistent with the information provided in the report. The information is subject to change without any prior notice.
Note 5: Dividend Yield may vary as per the stock price movement.
Technical Indicators Defined: -
Support: A level at which the stock prices tend to find support if they are falling, and a downtrend may take a pause backed by demand or buying interest. Support 1 refers to the nearby support level for the stock and if the price breaches the level, then Support 2 may act as the crucial support level for the stock.
Resistance: A level at which the stock prices tend to find resistance when they are rising, and an uptrend may take a pause due to profit booking or selling interest. Resistance 1 refers to the nearby resistance level for the stock and if the price surpasses the level, then Resistance 2 may act as the crucial resistance level for the stock.
Stop-loss: It is a level to protect further losses in case of unfavourable movement in the stock prices.
This report (“Report”) has been issued by Kalkine New Zealand Limited (FSP691351) (NZBN:9429047678101) (“Kalkine”). Kalkine is a Financial Advice Provider (“FAP”) and is authorised by a Class 1 Financial Advice Provider Licence issued by Financial Markets Authority (“FMA”) to provide financial advice. Kalkine provides only general financial advice through its research reports following a person becoming a member. The reports contain buy/sell/hold and other recommendations in relation to equity securities, managed funds and other managed investment schemes and other financial advice products. The recommendations and opinions in this Report and on Kalkine website do not take into account any of your investment objectives, financial situation or needs. Before you make a decision about whether to acquire a financial product, you should obtain the Product Disclosure Statement from the product issuer. You should consider the appropriateness of advice taking into account your own objectives, financial situation and needs and seek independent financial advice before making any financial decisions. If you act on the advice in the research reports, you may have to pay fees, expenses or other amounts (but not to Kalkine).
The information in this Report and on the Kalkine website has been prepared from a wide variety of sources, which Kalkine, to the best of its knowledge and belief, considers accurate. Kalkine has made every effort to ensure the reliability of the information contained in its reports (including this Report), newsletters and websites. All information represents our views at the date of publication and may change without notice.
Kalkine does not issue, sell or deal in any financial products. The information in this Report does not constitute an offer to sell securities or other financial products or a solicitation of an offer to buy securities or other financial products. Our reports contain general recommendations to invest in securities and other financial products. Kalkine is not responsible for, and does not guarantee, the performance of, or returns on, any investments mentioned in this Report.
This Report may contain information on past performance of particular investments. Past performance is not a reliable indicator of future performance. Returns stated do not take into account transaction costs and taxes.
Further information about the complaints and dispute resolution process, as well as information about Kalkine’s duties are available on Kalkine’s website. Please read our Financial Advice Provider (FAP) disclosure statement and Complaints Handling Guide, which are available on the website.
Copyright 2025 Krish Capital Pty. Ltd. (ABN 61629651510). All Rights Reserved. No part of this Report, or its content, may be reproduced in any form without our prior consent.
Past performance is not a reliable indicator of future performance.
 Please wait processing your request...