Company Overview: Genesis Minerals Limited (ASX: GMD) is engaged in gold mining, project development and exploration activities in the Leonora region of Western Australia. The company is primarily focused on the prolific Leonora District. Hipages Group Holdings Limited (ASX: HPG) is an online trading platform and SaaS provider that connects traders with residential and commercial consumers to ease out the process of property improvement. It operates an online marketplace and facilitates the connection of consumers to the trade service providers in the home improvement and natural therapy sectors. Kalkine’s Daily Report covers the Key Financial Metrics, Risks, Outlook, Technical Analysis along with the Valuation, Target Price, and Recommendation on the stock.
Genesis Minerals Limited (ASX: GMD)
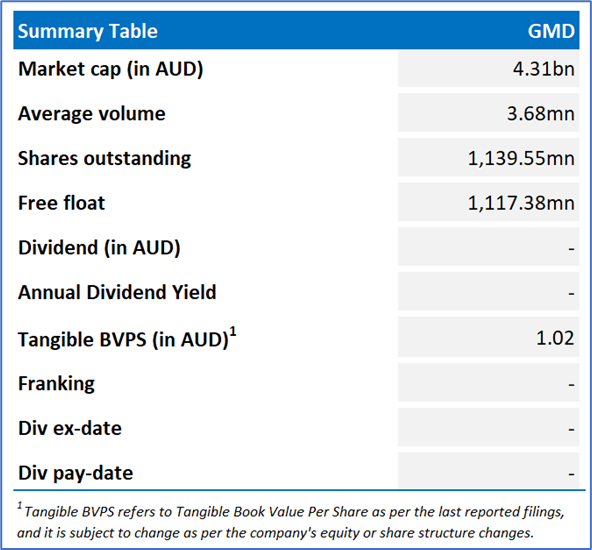
Section 1.0: Key Metrics in Pictures
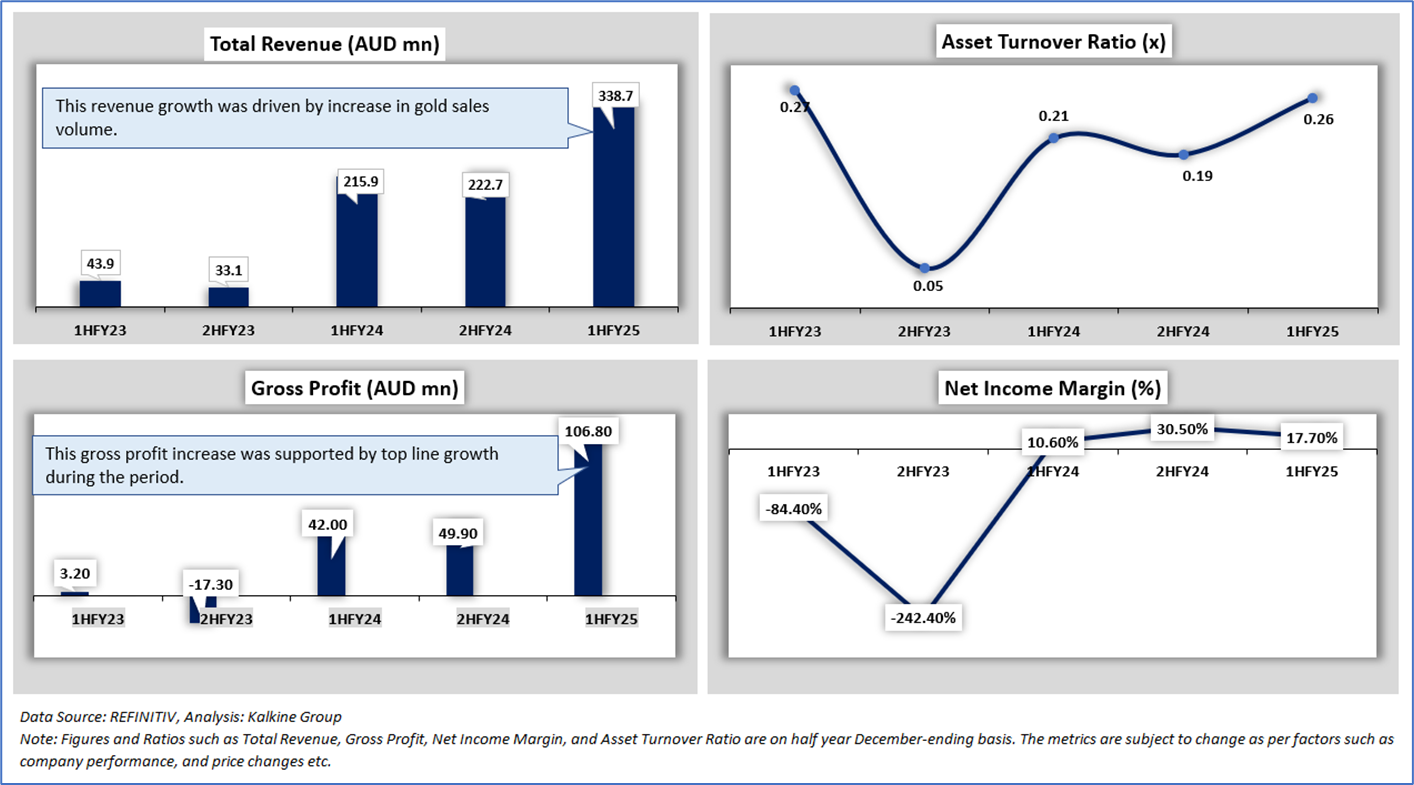
Having looked at the key financial metrics above the below sections provide an in-depth fundamental, and technical analysis on this Materials stock along with recommendation, technical support, and resistance level & indicative stop-loss.
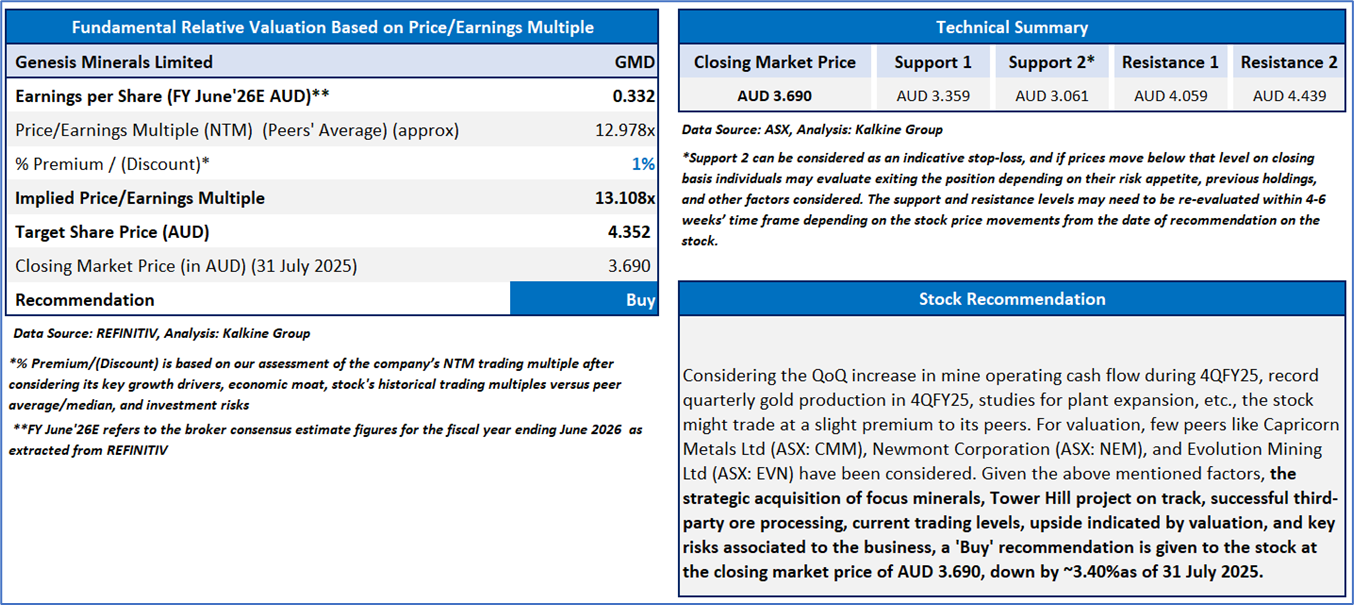
Section 2.0: Genesis Minerals Limited (ASX: GMD) (Buy’ at AUD 3.690, closing market price per share as on 31 July 2025)
2.1 Company Details
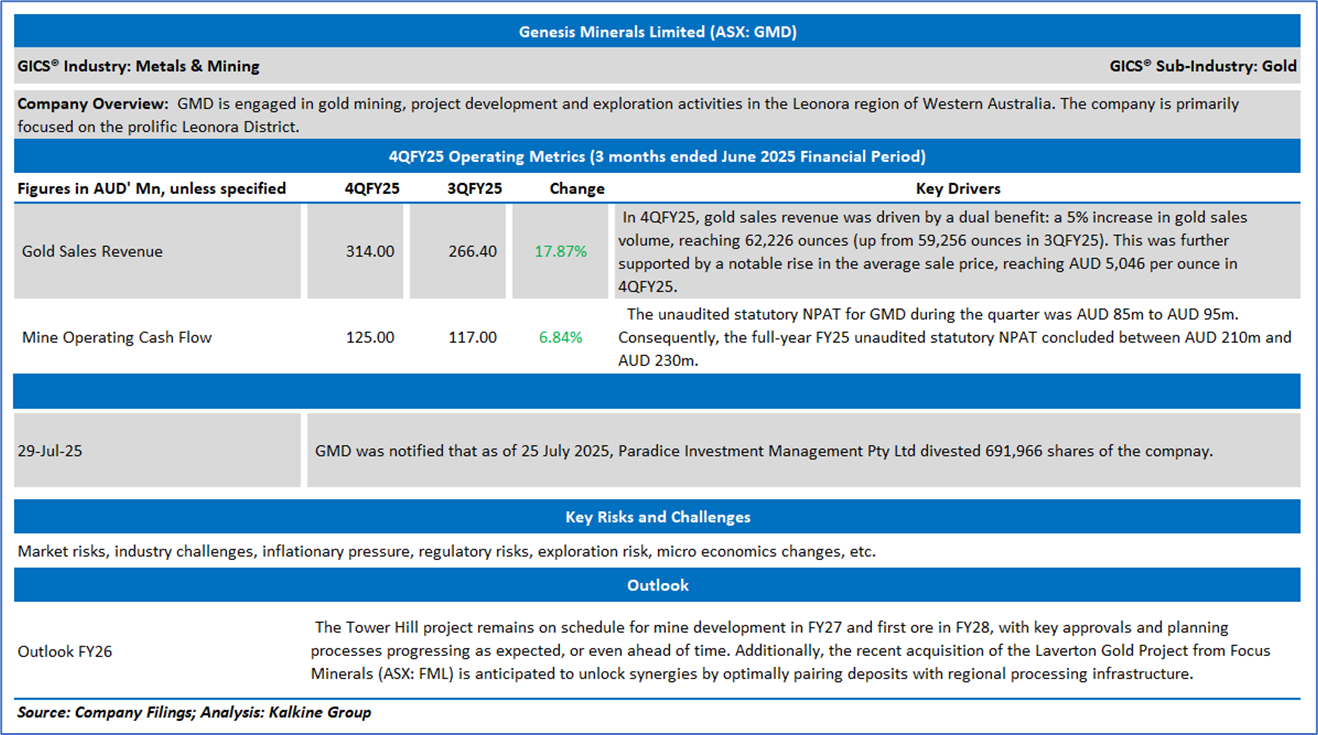
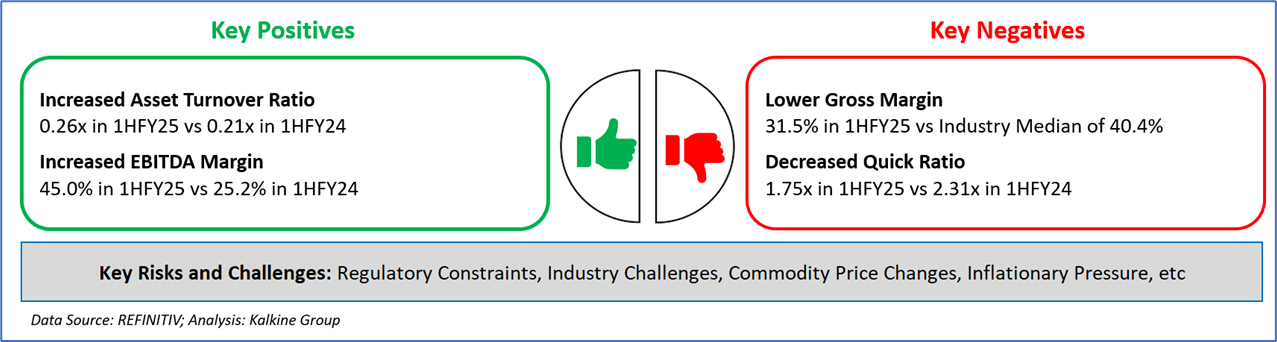
2.2 Valuation, Technical Summary & Stock Recommendation
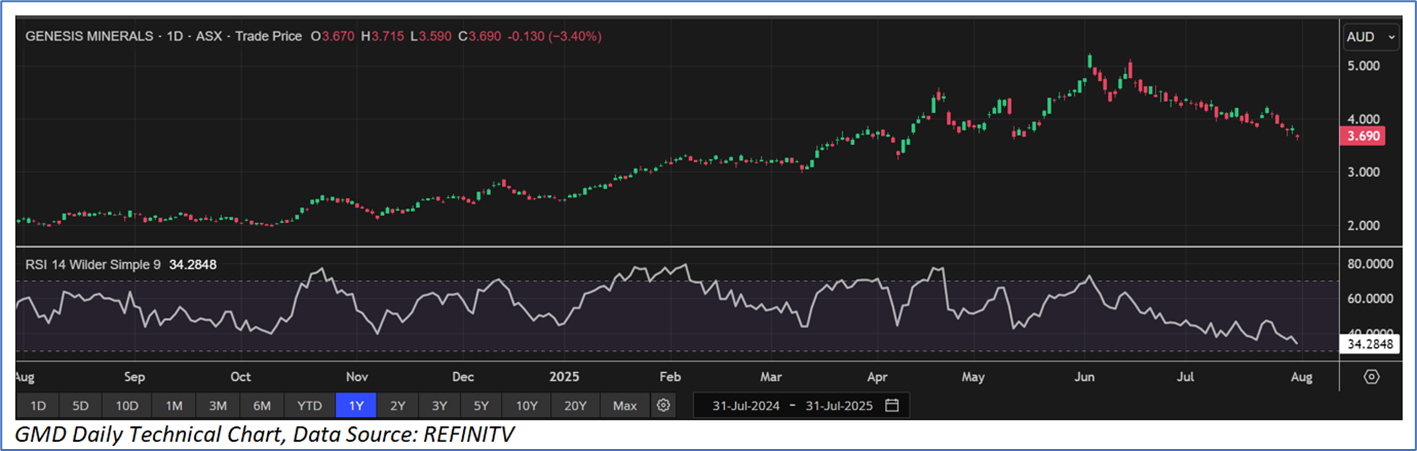
The stock has witnessed a dip of ~4.16% in the last 3 months, and over the past 6 months, it has increased by ~18.27%. The stock has a 52-week low and 52-week high of AUD 1.965 and AUD 5.240, respectively, and is currently trading above the 52-week high-low average. GMD was last covered in a report dated ‘23 October 2024’.
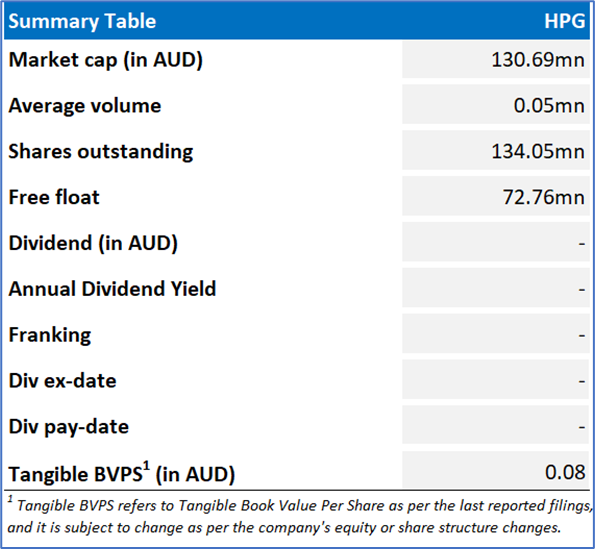
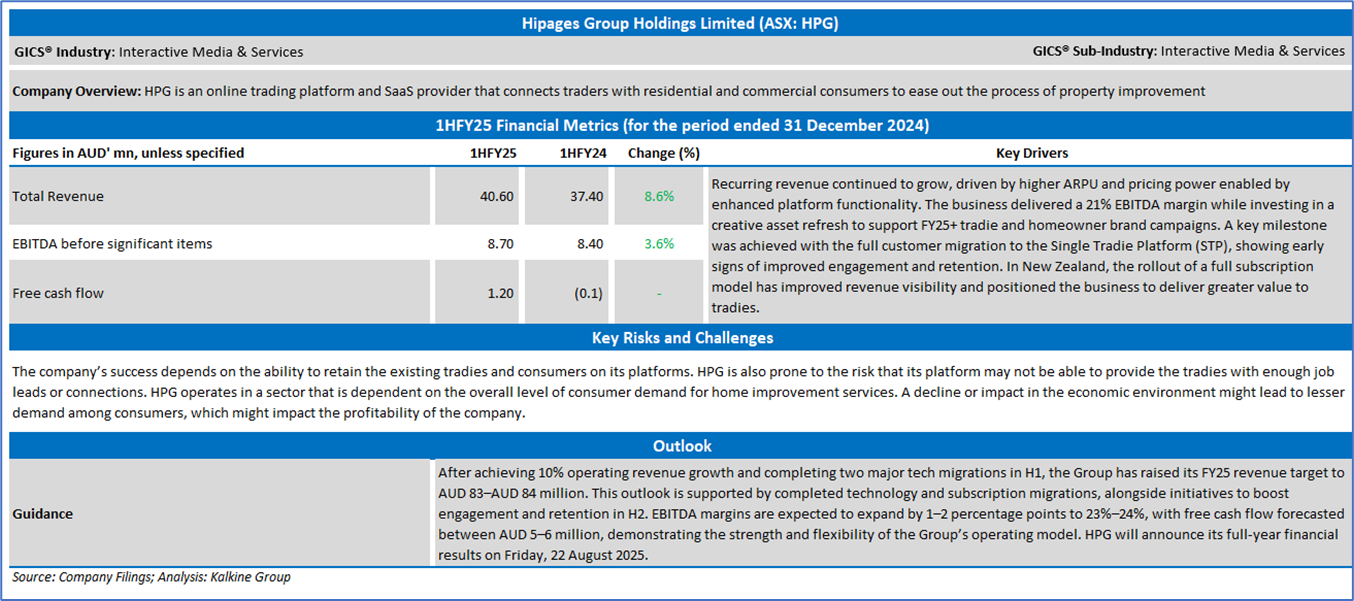
Hipages Group Holdings Limited (ASX: HPG)
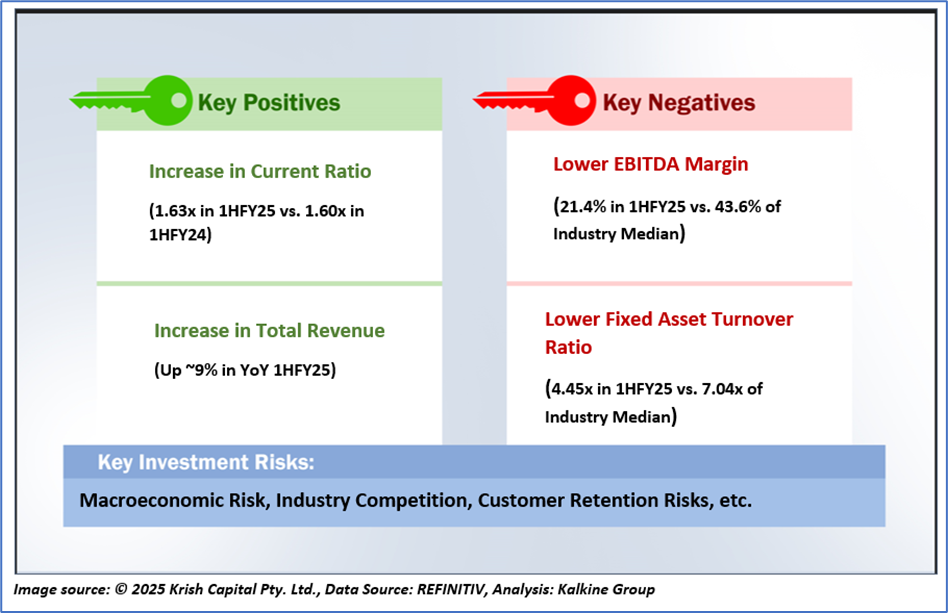
Section 3.0: Key Metrics in Pictures
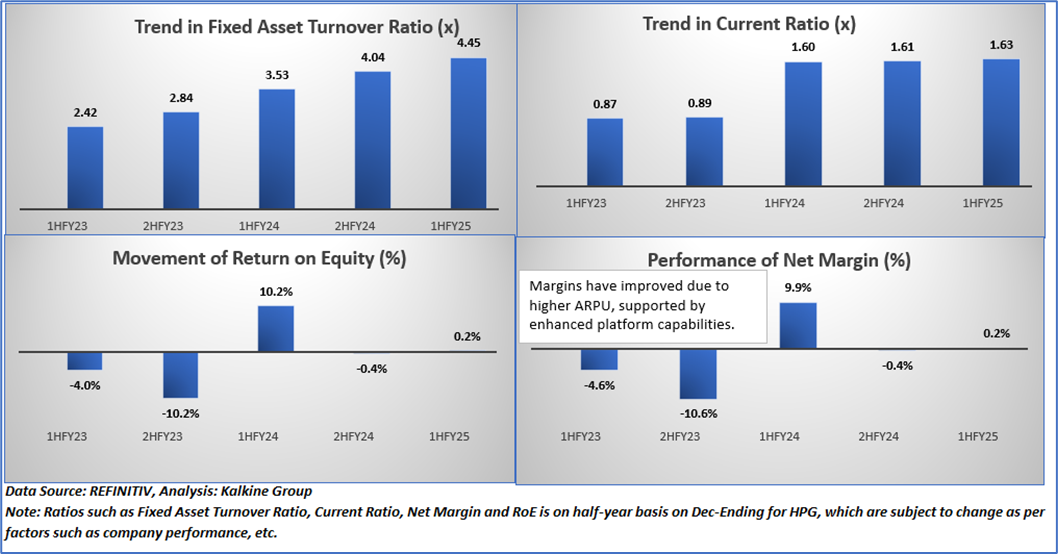
Having looked at the key financial ratios above, the below sections provide an in-depth fundamental, and technical analysis on this one ASX-listed Media & Entertainment stock along with recommendations, technical support and resistance levels and indicative stop-loss.
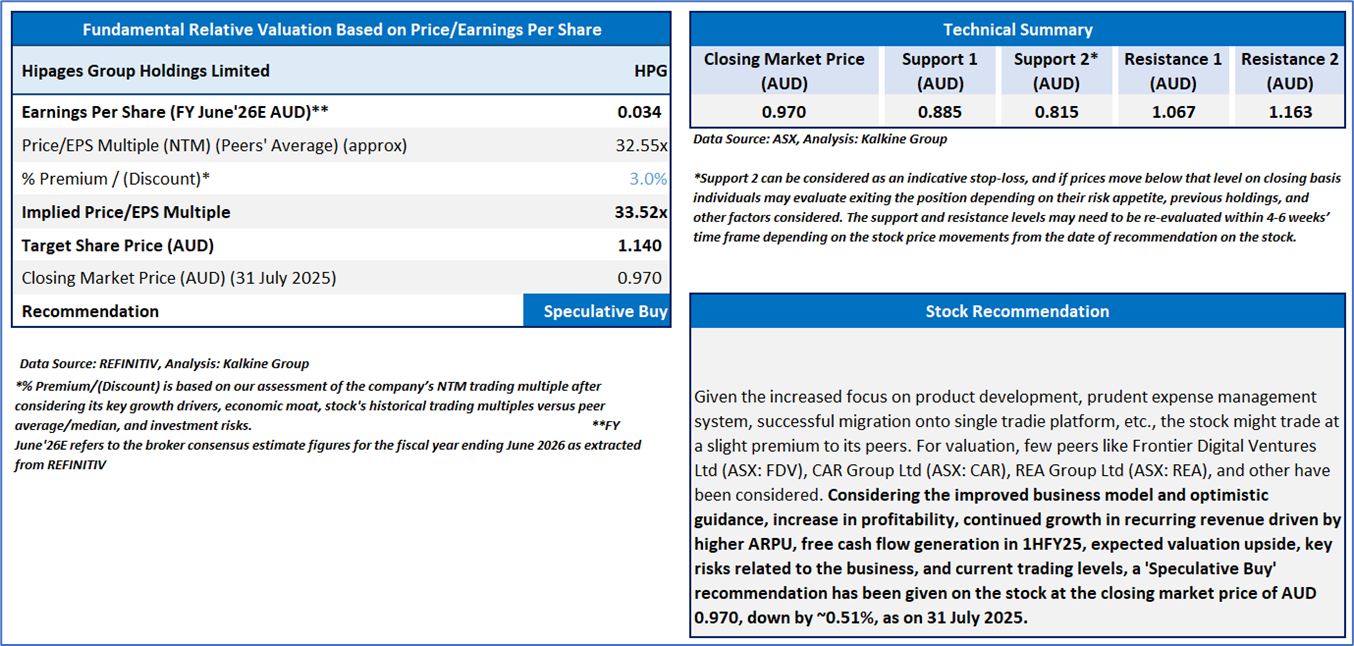
Section 4: Hipages Group Holdings Limited (ASX: HPG) (‘Speculative Buy’ at AUD 0.970 closing market price per share as on 31 July 2025)
4.1Company Details, Business Updates, Key Risks & Outlook
Section 4.2: Valuation and Recommendation Summary
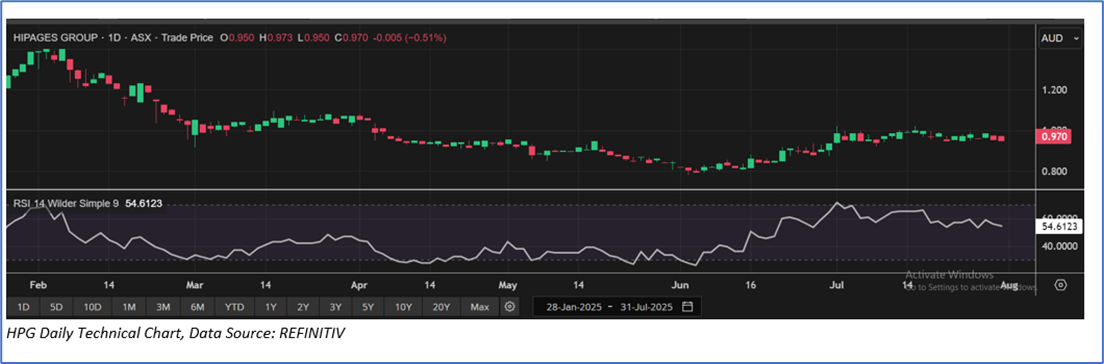
The stock has witnessed a decline of ~3.55% in the last one month and over the last three months, it has decreased by ~0.5%. The stock has a 52-week low and 52-week high of AUD 0.780 and AUD 1.623, respectively, and is currently trading below the average of 52-week high-low average. HPG was last covered in a report dated ’16 June 2025’.
Markets are trading in a highly volatile zone currently due to certain macro-economic issues and geopolitical tensions prevailing. Therefore, it is prudent to follow a cautious approach while investing.
Note 1: Past performance is not a reliable indicator of future performance.
Note 2: The reference date for all price data, currency, technical indicators, support, and resistance levels is 31 July 2025. The reference data in this report has been partly sourced from REFINITIV.
Note 3: Investment decisions should be made depending on an individual's appetite for upside potential, risks, holding duration, and any previous holdings. An 'Exit' from the stock can be considered if the Target Price mentioned as per the Valuation and or the technical levels provided have been achieved and is subject to the factors discussed above.
Note 4: Kalkine reports are prepared based on the stock prices captured either from REFINITIV or Trading View. Typically, REFINITIV or Trading View may reflect stock prices with a delay which could be a lag of 25-30 minutes. There can be no assurance that future results or events will be consistent with the information provided in the report. The information is subject to change without any prior notice.
Technical Indicators Defined: -
Support: A level at which the stock prices tend to find support if they are falling, and a downtrend may take a pause backed by demand or buying interest. Support 1 refers to the nearby support level for the stock and if the price breaches the level, then Support 2 may act as the crucial support level for the stock.
Resistance: A level at which the stock prices tend to find resistance when they are rising, and an uptrend may take a pause due to profit booking or selling interest. Resistance 1 refers to the nearby resistance level for the stock and if the price surpasses the level, then Resistance 2 may act as the crucial resistance level for the stock.
Stop-loss: It is a level to protect further losses in case of unfavourable movement in the stock prices.

 Please wait processing your request...