Sayona Mining Limited (ASX: SYA)
Sayona Mining Limited (ASX: SYA) is a lithium-focused exploration company with projects in Quebec, Canada, and Western Australia. The current market capitalization as of 24 January 2023 stood at AUD 2.25 billion.
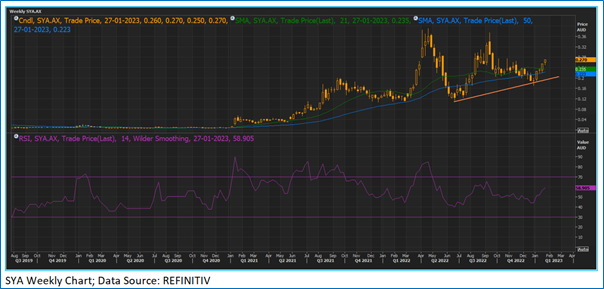
Technical Analysis: SYA prices took support at an upward sloping trendline and inched higher, indicating the possibility of further uptrend hereon. Moreover, the momentum oscillator RSI (14-period) is in the positive territory and shows a reading of ~58.905, supporting positive bias. Further, prices are trading above the trend following indicators 21- Period SMA and 50- Period SMA, which may act as support levels in the near term. Immediate support levels are AUD 0.240 and AUD 0.222, while the key resistance levels are AUD 0.305 and AUD 0.327.
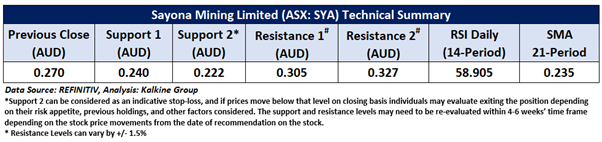
Considering the Company's current price levels facing resistance at the trendline, and momentum oscillator analysis, it is prudent to recommend a 'Speculative Buy' rating on this stock. The stock was analyzed at the closing price of AUD 0.270 per share on 24 January 2023, up 3.846%.
Weekly Technical Chart – SYA
Nova Minerals Limited (ASX: NVA)
Nova Minerals Limited is an exploration company focused on Alaska’s Tintina Gold Belt, Victoria Gold’s Eagle Mine, and Kinross Gold Corporation’s Fort Knox Gold Mine. The current market capitalization as of 24 January 2023 stood at AUD 140.73 million.
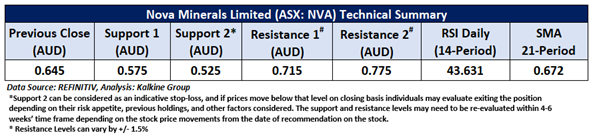
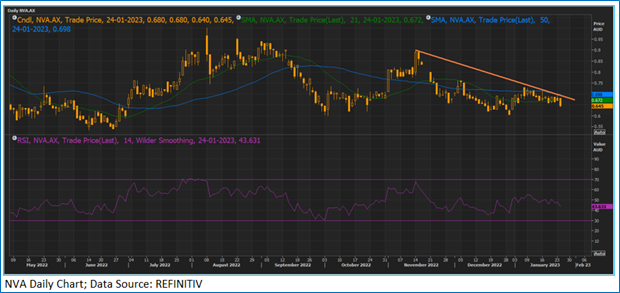
Technical Analysis: NVA prices are trading below the downward sloping trendline and facing the resistance of the same, indicating the possibility of further downward move hereon. Moreover, the momentum oscillator RSI (14-period) is hovering below the mid-point and shows a reading of ~43.631. Further, prices are trading below the trend following indicators 21- Period SMA and 50- Period SMA, which may act as resistance levels in the near term. Immediate support levels are AUD 0.575 and AUD 0.525, while the key resistance levels are AUD 0.715 and AUD 0.775.
Individuals can evaluate the stock based on the support and resistance levels provided in the report in case of keen interest, taking into consideration the risk-reward scenario.
Considering the Company's current price levels trading below the falling trendline and momentum oscillator analysis, it is prudent to recommend a 'Watch' rating on this stock. The stock was analyzed at the closing price of AUD 0.645 per share on 24 January 2023, down -3.731%.
Daily Technical Chart – NVA
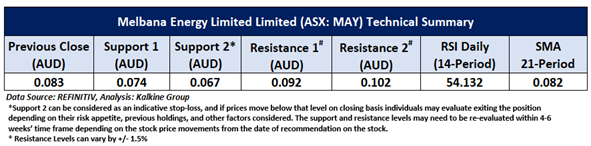
Melbana Energy Limited (ASX: MAY)
Melbana Energy Limited is an oil and gas company focused on oil and gas exploration in Cuba and Australia. The current market capitalization as of 24 January 2023 stood at AUD 259.50 million.
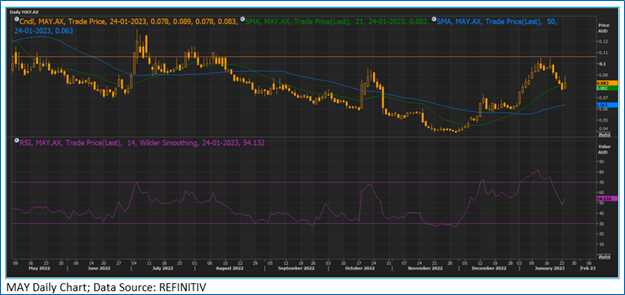
Technical Analysis: MAY prices are trading below the horizontal trendline and facing the resistance of the same, indicating the possibility of further downward move hereon. Moreover, the momentum oscillator RSI (14-period) is hovering near the mid-point and shows a reading of ~54.132. However, prices are trading above the trend following indicators 50- Period SMA, which may act as support levels in the near term. Immediate support levels are AUD 0.074 and AUD 0.067, while the key resistance levels are AUD 0.092 and AUD 0.102.
Individuals can evaluate the stock based on the support and resistance levels provided in the report in case of keen interest, taking into consideration the risk-reward scenario.
Considering the Company's current price levels trading below the horizontal trendline and momentum oscillator analysis, it is prudent to recommend a 'Watch' rating on this stock. The stock was analyzed at the closing price of AUD 0.083 per share on 24 January 2023, up 7.792%.
Daily Technical Chart – MAY
Markets are trading in a highly volatile zone currently due to certain macro-economic issues and geopolitical tensions prevailing. Therefore, it is prudent to follow a cautious approach while investing.
Note 1: Past performance is neither an Indicator nor a guarantee of future performance.
Note 2: Investment decision should be made depending on an individual’s appetite for upside potential, risks, and any previous holdings. This recommendation is purely based on technical analysis, and fundamental analysis has not been considered in this report.
Note 3: Related Risks: This report may be looked at from high-risk perspective and recommendations are provided are for a short duration. Recommendations provided in this report are solely based on technical parameters, and the fundamental performance of the stocks has not been considered in the decision-making process. Other factors which could impact the stock prices include market risks, regulatory risks, interest rates risks, currency risks, social and political instability risks etc.
Technical Indicators Defined: -
Support: A level at which the stock prices tend to find support if they are falling, and a downtrend may take a pause backed by demand or buying interest. Support 1 refers to the nearby support level for the stock and if the price breaches the level, then Support 2 may act as the crucial support level for the stock.
Resistance: A level at which the stock prices tend to find resistance when they are rising, and an uptrend may take a pause due to profit booking or selling interest. Resistance 1 refers to the nearby resistance level for the stock and if the price surpasses the level, then Resistance 2 may act as the crucial resistance level for the stock.
Stop-loss: It is a level to protect further losses in case of unfavourable movement in the stock prices.
The Green colour line reflects the 21-period moving average. SMA helps to identify existing price trends. If the prices are trading above the 21-period, prices are currently in a bullish trend (Vice – Versa).
The Blue colour line reflects the 50-period moving average. SMA helps to identify existing price trends. If the prices are trading above the 50-period, prices are currently in a bullish trend (Vice – Versa).
The Orange/ Yellow colour line represents the Trendline.
The Purple colour line in the chart’s lower segment reflects the Relative Strength Index (14-Period), which indicates price momentum and signals momentum in trend. A reading of 70 or above suggests overbought status, while a reading of 30 or below suggests an oversold status.
Disclaimer
Kalkine New Zealand Limited is a Financial Advice Provider (“FAP”) and is authorised by a Transitional FAP license issued by Financial Markets Authority (“FMA”) to provide financial advice. Kalkine provides only general financial advice through its research reports following a person becoming a member. The reports contain buy/sell/hold and other recommendations in relation to equity financial products. The recommendations and opinions [on this website] / [in this report] do not take into account any of your investment objectives, financial situation or needs. Before you make a decision about whether to acquire a financial product, you should obtain the Product Disclosure Statement from the product issuer. You should consider the appropriateness of advice taking into account your own objectives, financial situation and needs and seek independent financial advice before making any financial decisions. If you act on the advice in the research reports, you may have to pay fees, expenses or other amounts (but not to Kalkine). Further information about the complaints and dispute resolution process, as well as information about Kalkine’s duties are available on Kalkine’s website. Please read our Financial Advice Provider (FAP) disclosure statement and Complaints Handling Guide, which are available on the website.

 Please wait processing your request...