Company Overview: Pro Medicus Limited (ASX: PME) is an Australian healthcare technology company specializing in medical imaging software. It provides radiology information systems (RIS), picture archiving and communication systems (PACS), and advanced visualization tools to hospitals, imaging centers, and healthcare organizations across Australia, North America, and Europe. This Report covers the Price Action, Technical Indicators Analysis along with the Support Levels, Resistance Levels, and Recommendations on this stock.
Recent Updates:
On 4 February 2025, Pro Medicus Limited (ASX: PME) saw around 5% increase in its share price following the announcement of a seven-year contract with BayCare, a major healthcare system in Florida. The contract will implement Pro Medicus’ Visage 7 Enterprise Imaging Platform, aimed at enhancing BayCare’s diagnostic imaging capabilities, with the rollout scheduled for late 2025. This partnership is expected to strengthen Pro Medicus' position in the North American healthcare IT market, where the company has made significant inroads.
Since 2023, Pro Medicus has secured 19 new contracts, mainly in the US, underscoring its expanding market presence. CEO Dr. Sam Hupert shared that for the full year 2024, the company achieved record results, with revenue increasing by 29% YoY to AU$161.5 million and net profit rising 36.5% YoY to AU$82.8 million. He expressed confidence in sustaining growth despite challenges in maintaining 30%+ annual growth rates as the company scales. The company’s transaction-based model and large contracts are expected to drive future growth. North America continues to be the primary revenue driver, accounting for nearly 90% of its total revenue, supported by Pro Medicus’ proprietary technology and rapid implementation capabilities. The company now serves 11 of the top 20 hospitals in the US. While the US remains the focal point, Pro Medicus is also exploring expansion opportunities in Europe and Asia, where healthcare IT adoption lags behind North America.
Pro Medicus is expected to release its H1 FY25 results on 13 February 2025.
PME’s Technical Analysis:
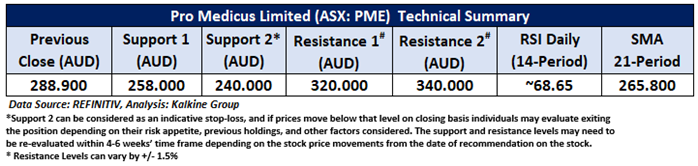
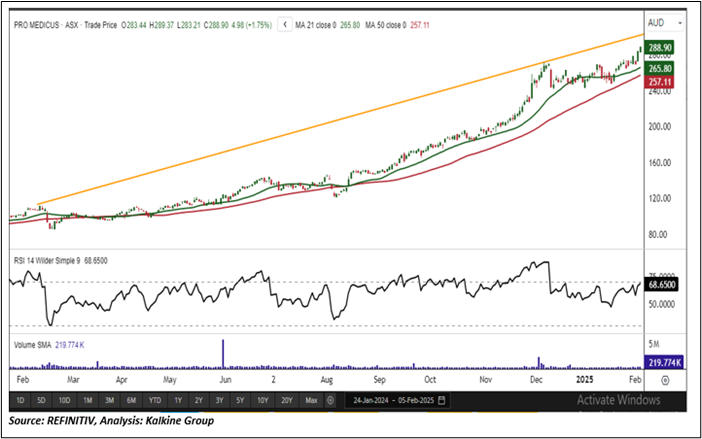
On the daily chart, PME prices remain below the rising trendline resistance. The 14-period RSI momentum oscillator is currently around 68.65, indicating strong momentum but approaching overbought territory. Meanwhile, the stock is trading above the 21-period SMA, which serves as a key support zone. Critical support is positioned at AUD 258.00, while key resistance levels are set at AUD 320.00.
Daily Technical Chart – PME
The stock was analysed as per the closing price of AUD 288.90 per share as on 05 February 2025, up by 1.754%. Pro Medicus Limited (ASX: PME) was last covered in a report dated ’16 May 2024’.
Individuals can evaluate the stock based on the support and resistance levels provided in the report in case of keen interest, taking into consideration the risk-reward scenario.
Note 1: Past performance is neither an Indicator nor a guarantee of future performance.
Note 2: Investment decision should be made depending on an individual’s appetite for upside potential, risks, and any previous holdings. This recommendation is purely based on technical analysis, and fundamental analysis has not been considered in this report.
Note 3: Related Risks: This report may be looked at from high-risk perspective and recommendations are provided are for a short duration. Recommendations provided in this report are solely based on technical parameters, and the fundamental performance of the stocks has not been considered in the decision-making process. Other factors which could impact the stock prices include market risks, regulatory risks, interest rates risks, currency risks, social and political instability risks etc.
The reference date for all price data, currency, technical indicators, support, and resistance levels is February 05, 2025. The reference data in this report has been partly sourced from REFINITIV.
Technical Indicators Defined:
Support: A level at which the stock prices tend to find support if they are falling, and a downtrend may take a pause backed by demand or buying interest. Support 1 refers to the nearby support level for the stock and if the price breaches the level, then Support 2 may act as the crucial support level for the stock.
Resistance: A level at which the stock prices tend to find resistance when they are rising, and an uptrend may take a pause due to profit booking or selling interest. Resistance 1 refers to the nearby resistance level for the stock and if the price surpasses the level, then Resistance 2 may act as the crucial resistance level for the stock.
Stop-loss: It is a level to protect further losses in case of unfavourable movement in the stock prices.
The Green colour line reflects the 21-period moving average. SMA helps to identify existing price trends. If the prices are trading above the 21-period, prices are currently in a bullish trend (Vice – Versa).
The Blue colour line reflects the 50-period moving average. SMA helps to identify existing price trends. If the prices are trading above the 50-period, prices are currently in a bullish trend (Vice – Versa).
The Orange/ Yellow colour line represents the Trendline.
The Purple colour line in the chart’s lower segment reflects the Relative Strength Index (14-Period), which indicates price momentum and signals momentum in trend. A reading of 70 or above suggests overbought status, while a reading of 30 or below suggests an oversold status.

 Please wait processing your request...