Company Overview: SKY Network Television Limited (ASX: SKT) provides sport and entertainment media services, and telecommunications services in New Zealand and internationally, which offers commercial music, broadband, entertainment quizzes, advertising, and streaming services, as well as broadcasting services. Advance ZincTek Limited (ASX: ANO) manufactures aluminium oxide powder, and zinc oxide dispersions and powder for use in the personal care sector in Australia, the United States, Canada, Europe, and internationally. This Report covers the Price Action, Technical Indicators Analysis along with the Support Levels, Resistance Levels, and Recommendations on these stocks.
SKT’s Technical Analysis:
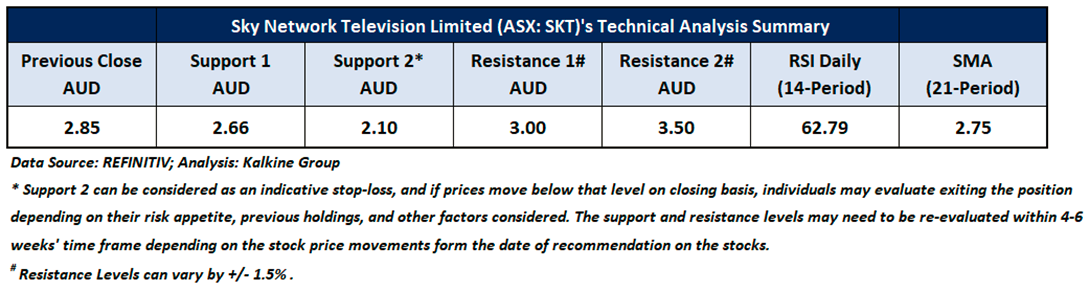
On the daily chart, SKT's stock price broke above the upper boundary of an ascending triangle pattern established since March 2022, signalling a positive trend. Additionally, the RSI (14-period) is heading north from its midpoint, providing further support for the mentioned recommendation. Prices are trading above both the 21-period and 50-day SMAs, which may potentially function as dynamic support levels for the stock; in contrast, the stock’s next round level might act as a sentimental resistance. Crucial support for the stock is positioned at AUD 2.66, while key resistance is placed at AUD 3.00.

Daily Technical Chart – SKT
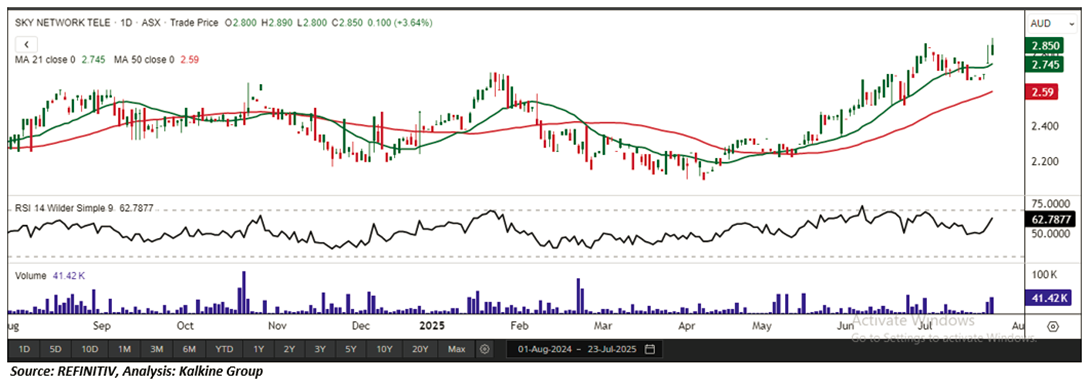
Considering the stock’s current price levels breaking above the upper boundary of an ascending triangle pattern, and momentum oscillator analysis, a “Speculative Buy” recommendation is given on the stock. The stock was analysed as per the closing price of AUD 2.85 per share as on 23 July 2025, up by 3.64%. SKY Network Television Limited (ASX: SKT) was last covered in a report dated ’31 August 2021’.
ANO’s Technical Analysis:
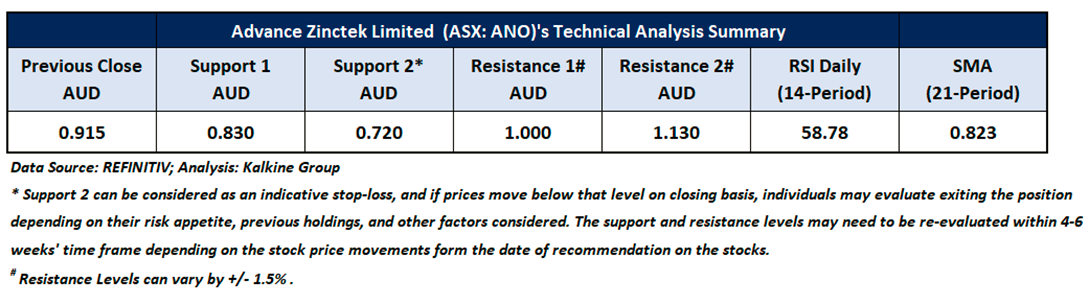
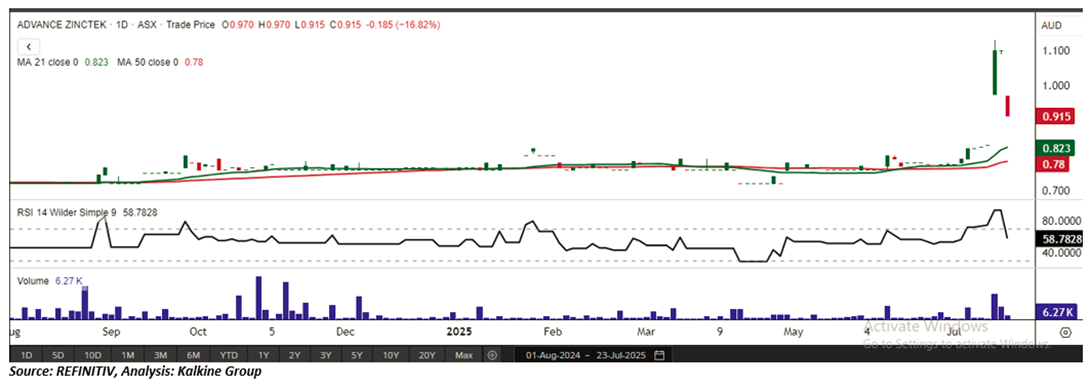
On the daily chart, ANO’s stock prices are forming a trading range characterized by identical highs and lows, suggesting that the current sideways period in the stock might continue to persist in the near future. Additionally, the RSI (14-period) is trading near its midpoint, adding more evidence to the previous analysis. Prices are trading between its previous peak and trough, which may potentially function resistance and support levels for the stock, respectively. Critical support for the stock is positioned at AUD 0.830, while significant resistance is placed at AUD 1.130.
Daily Technical Chart – ANO
Individuals can evaluate the stock based on the support and resistance levels provided in the report in case of keen interest, taking into consideration the risk-reward scenario.
Considering the stock’s current price levels forming a trading range, and momentum oscillator analysis, a “Watch” recommendation is given on the stock. The stock was analysed as per the closing price of AUD 0.915 per share as on 23 July 2025, down by 16.82%. Advance ZincTek Limited (ASX: ANO) was last covered in a report dated ’29 October 2021’.
Note 1: Past performance is neither an Indicator nor a guarantee of future performance.
Note 2: Investment decision should be made depending on an individual’s appetite for upside potential, risks, and any previous holdings. This recommendation is purely based on technical analysis, and fundamental analysis has not been considered in this report.
Note 3: Related Risks: This report may be looked at from high-risk perspective and recommendations are provided are for a short duration. Recommendations provided in this report are solely based on technical parameters, and the fundamental performance of the stocks has not been considered in the decision-making process. Other factors which could impact the stock prices include market risks, regulatory risks, interest rates risks, currency risks, social and political instability risks etc.
The reference date for all price data, currency, technical indicators, support, and resistance levels is July 23, 2025. The reference data in this report has been partly sourced from REFINITIV.
Technical Indicators Defined:
Support: A level at which the stock prices tend to find support if they are falling, and a downtrend may take a pause backed by demand or buying interest. Support 1 refers to the nearby support level for the stock and if the price breaches the level, then Support 2 may act as the crucial support level for the stock.
Resistance: A level at which the stock prices tend to find resistance when they are rising, and an uptrend may take a pause due to profit booking or selling interest. Resistance 1 refers to the nearby resistance level for the stock and if the price surpasses the level, then Resistance 2 may act as the crucial resistance level for the stock.
Stop-loss: It is a level to protect further losses in case of unfavourable movement in the stock prices.
The Green colour line reflects the 21-period moving average. SMA helps to identify existing price trends. If the prices are trading above the 21-period, prices are currently in a bullish trend (Vice – Versa).
The Blue colour line reflects the 50-period moving average. SMA helps to identify existing price trends. If the prices are trading above the 50-period, prices are currently in a bullish trend (Vice – Versa).
The Orange/ Yellow colour line represents the Trendline.
The Purple colour line in the chart’s lower segment reflects the Relative Strength Index (14-Period), which indicates price momentum and signals momentum in trend. A reading of 70 or above suggests overbought status, while a reading of 30 or below suggests an oversold status.

 Please wait processing your request...