Company Overview: Patriot Battery Metals Inc. (ASX: PMT) engages in the identification, evaluation, acquisition, and exploration of mineral properties, primarily exploring for gold, copper, silver, platinum, and lithium deposits. Elsight Ltd (ASX: ELS) is a technology company specializing in AI-driven connectivity solutions for unmanned systems. Its flagship product, the Halo, utilizes multi-link bonding technology to ensure highly reliable and secure communication by integrating cellular, satellite, and RF networks. This Report covers the Price Action, Technical Indicators Analysis along with the Support Levels, Resistance Levels, and Recommendations on these stocks.
PMT’s Technical Analysis:
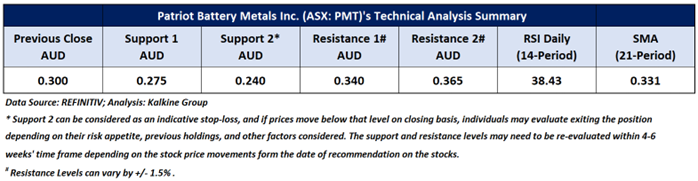
On the daily chart, PMT's stock price is forming a descending wedge pattern, suggesting that the downside momentum is halting. Moreover, if the stock manages to surpass the pattern’s upper boundary, it might gain more momentum to head higher. Additionally, the RSI (14-period) is developing a bottom divergence near its oversold region in relation to price, providing further support for the mentioned recommendation. Prices are trading between its previous peak and trough, which may potentially function as resistance and support levels for the stock, respectively. Crucial support for the stock is positioned at AUD 0.275, while key resistance is placed at AUD 0.340.

Daily Technical Chart – PMT
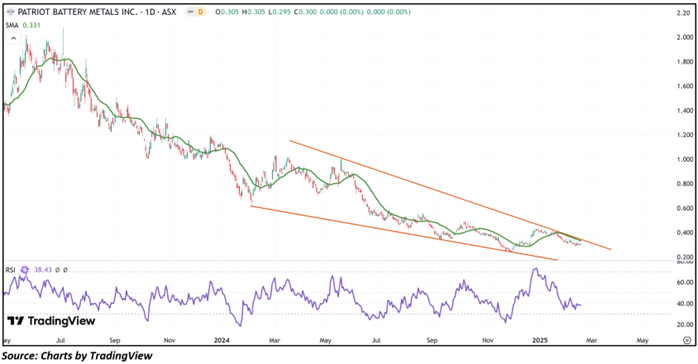
Considering the stock’s current price levels forming a descending wedge pattern, and momentum oscillator analysis, a “Speculative Buy” recommendation is given on the stock. The stock was analysed as per the closing price of AUD 0.300 per share as on 18 February 2025, remained unchanged.
FY24 Financial and Operational Highlights (for the 12-month period ended 31 December 2025)
ELS reported 32% YoY increase in FY24 to over US$2 million, driven by rising demand from the defense sector, which contributed 51% of total revenue, up from 37% in 2023. Recurrent revenue surged 83%, adding US$340K in FY24.
In Q4 FY24, revenue grew 5% quarter-over-quarter, primarily due to a large defense order in Q3. The company secured seven new Design-Win customers, including major defense contractors in EMEA and Lockheed Martin (U.S.), strengthening its position in the global defense market.
Additionally, Elsight signed a distributor agreement with Tukom, expanding its footprint in the DACH region (Germany, Austria, Switzerland). A key highlight of the year was Phoenix Air Unmanned’s successful completion of a 320-mile pipeline patrol for Shell, showcasing the capabilities of Elsight’s Halo-powered UAS for Beyond Visual Line of Sight (BVLOS) operations.
Moreover, Elsight secured its largest defense order, with revenue expected to begin flowing in Q1 FY25. Strengthening its financial position, the company eliminated all convertible note debt, making it debt-free. With growing market adoption of its Halo connectivity solutions, Elsight is well-positioned for continued expansion in the defense, infrastructure, and unmanned systems sectors.
ELS’ Technical Analysis:
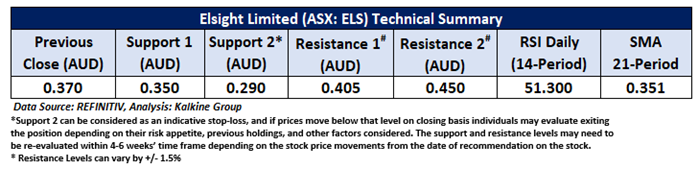
On the daily chart, ELS' stock price is bouncing off the lower boundary of a trading range, indicating a short-term upward trend that could drive the stock toward the range’s upper limit. Additionally, the RSI (14-period) is trading above its midpoint, adding more evidence to the previous observation. Prices are trading between its previous peak and trough, which may potentially function as resistance and support levels for the stock, respectively. Critical support for the stock is positioned at AUD 0.350, while significant resistance is placed at AUD 0.405.

Daily Technical Chart – ELS
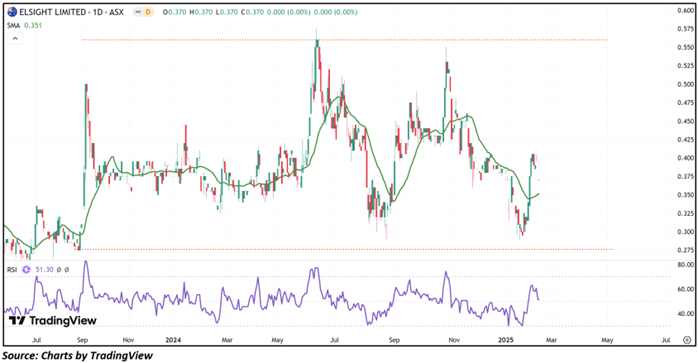
Considering the stock’s current price levels rebounding from the lower boundary of a trading range, and momentum oscillator analysis, a “Speculative Buy” recommendation is given on the stock. The stock was analysed as per the closing price of AUD 0.370 per share as on 18 February 2025, remained unchanged.
Note 1: Past performance is neither an Indicator nor a guarantee of future performance.
Note 2: Investment decision should be made depending on an individual’s appetite for upside potential, risks, and any previous holdings. This recommendation is purely based on technical analysis, and fundamental analysis has not been considered in this report.
Note 3: Related Risks: This report may be looked at from high-risk perspective and recommendations are provided are for a short duration. Recommendations provided in this report are solely based on technical parameters, and the fundamental performance of the stocks has not been considered in the decision-making process. Other factors which could impact the stock prices include market risks, regulatory risks, interest rates risks, currency risks, social and political instability risks etc.
The reference date for all price data, currency, technical indicators, support, and resistance levels is February 18, 2025. The reference data in this report has been partly sourced from REFINITIV.
Technical Indicators Defined:
Support: A level at which the stock prices tend to find support if they are falling, and a downtrend may take a pause backed by demand or buying interest. Support 1 refers to the nearby support level for the stock and if the price breaches the level, then Support 2 may act as the crucial support level for the stock.
Resistance: A level at which the stock prices tend to find resistance when they are rising, and an uptrend may take a pause due to profit booking or selling interest. Resistance 1 refers to the nearby resistance level for the stock and if the price surpasses the level, then Resistance 2 may act as the crucial resistance level for the stock.
Stop-loss: It is a level to protect further losses in case of unfavourable movement in the stock prices.
The Green colour line reflects the 21-period moving average. SMA helps to identify existing price trends. If the prices are trading above the 21-period, prices are currently in a bullish trend (Vice – Versa).
The Blue colour line reflects the 50-period moving average. SMA helps to identify existing price trends. If the prices are trading above the 50-period, prices are currently in a bullish trend (Vice – Versa).
The Orange/ Yellow colour line represents the Trendline.
The Purple colour line in the chart’s lower segment reflects the Relative Strength Index (14-Period), which indicates price momentum and signals momentum in trend. A reading of 70 or above suggests overbought status, while a reading of 30 or below suggests an oversold status.

 Please wait processing your request...