Company Overview: Paladin Energy Limited (ASX: PDNDA) focuses on the production of uranium, and it operates through its various projects that are located in Australia and Africa, including Langer Heinrich Mine, Kayelekera, Mount Isa, Michelin, and Manyingee projects. The group has business operations in Australia and internationally. Ovanti Limited (ASX: OVT) engages in in providing fintech and digital commerce software solutions, empowering institutional clients to securely and efficiently authenticate end-user customers while seamlessly managing banking, purchasing, and payment transactions. This Report covers the Price Action, Technical Indicators Analysis along with the Support Levels, Resistance Levels, and Recommendations on these stocks.
PDNDA’s Technical Analysis:
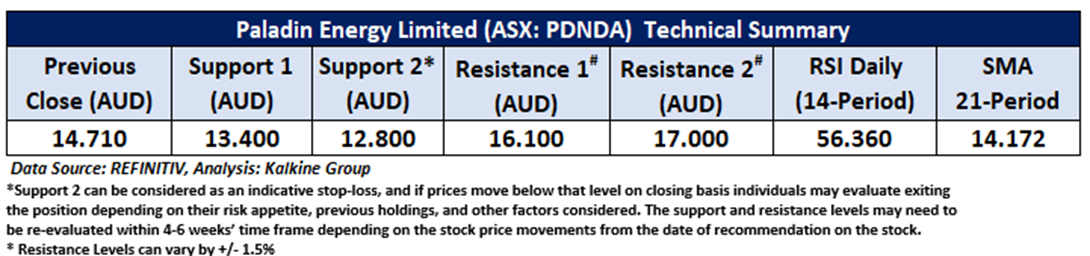
On the daily chart, 2023, PDNDA's stock price is establishing an uptrend characterized by higher highs and higher lows, signalling a positive trend. Additionally, the RSI (14-period) is heading north from the midpoint, providing further support for the mentioned recommendation. Prices are trading above both the 21-period and 50-day SMAs, which may potentially function as dynamic support levels for the stock; in contrast, the stock’s next round level might act as a sentimental resistance level. Critical support for the stock is positioned at AUD 13.40, while significant resistance is placed at AUD 16.10.

Daily Technical Chart – PDNDA
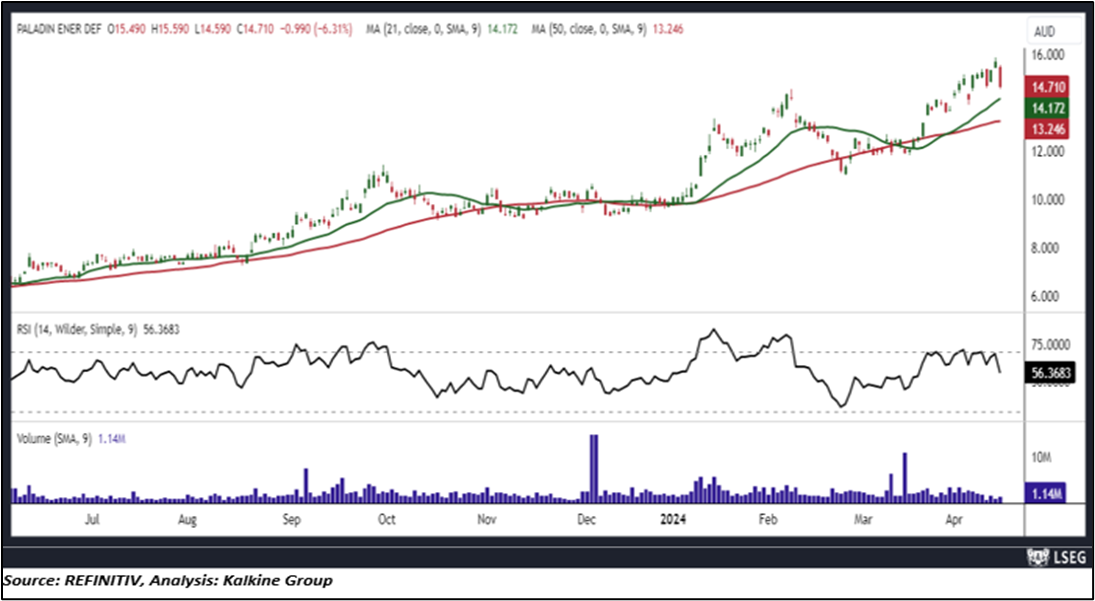
Considering the stock’s current price levels forming higher peaks and higher troughs, and momentum oscillator analysis, a “Speculative Buy” recommendation is given on the stock. The stock was analysed as per the closing price of AUD 14.71 per share as on 16 April 2024, down by 6.31%. Paladin Energy Limited (ASX: PDNDA) was last covered in a report dated ‘December 01, 2023’.
OVT’s Technical Analysis:
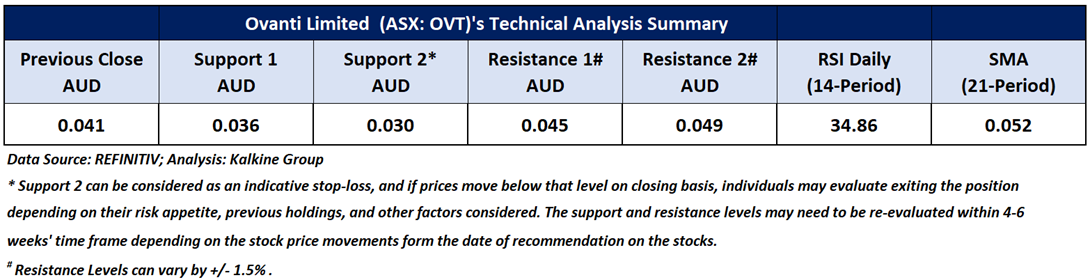
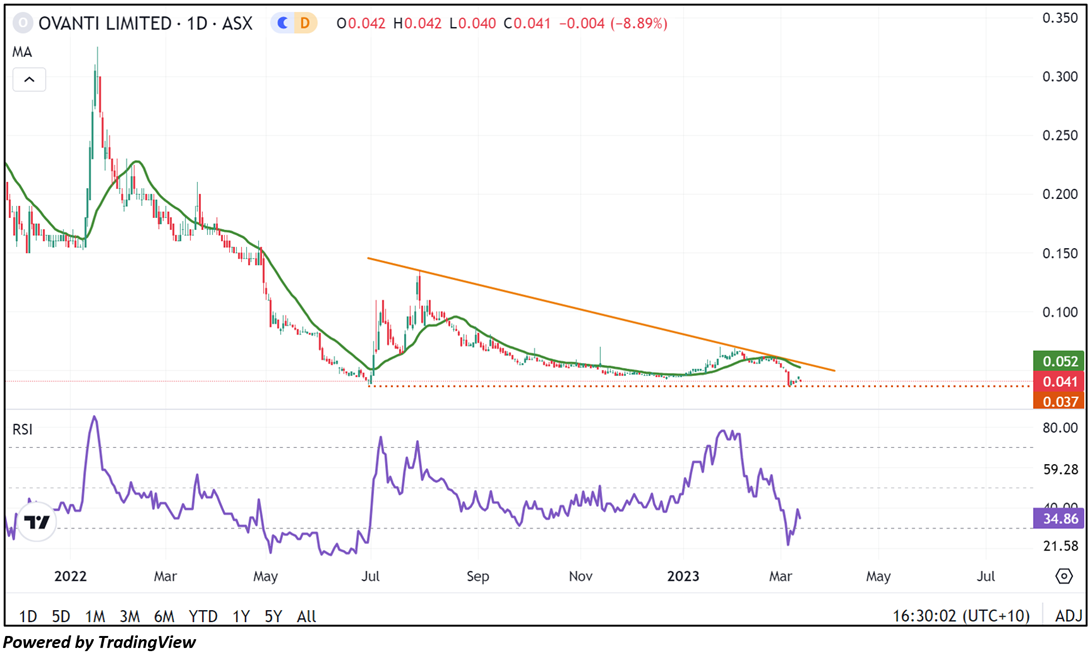
On the daily chart, OVT's stock price is forming a trading range characterized by lower highs and identical lows, suggesting that the sideways period in the stock might continue to persist in the near future. Moreover, while rebounding from the oversold region, the RSI (14-period) remains weak by showing the level of 34.86, providing further support for the previous observation. Prices are trading below both the 21-period and 50-day SMAs, which may potentially function as dynamic resistance levels for the stock; in contrast, the stock’s most recent low might act as a support level. Important support for the stock is positioned at AUD 0.036, while key resistance is placed at AUD 0.045.
Daily Technical Chart – OVT
Individuals can evaluate the stock based on the support and resistance levels provided in the report in case of keen interest, taking into consideration the risk-reward scenario.
Considering the stock’s current price levels forming a trading range, and momentum oscillator analysis, a “Watch” recommendation is given on the stock. The stock was analysed as per the closing price of AUD 0.041 per share as on 13 March 2024, down by 8.89%. Ovanti Limited (ASX: OVT) was last covered in a report dated ‘January 13, 2021’.
Disclosure: Ovanti Limited is a client of Kalkine Media Pty Ltd (Kalkine Media), an affiliate of Kalkine. However, under no circumstances have Kalkine or its related entities been, directly or indirectly influenced in making any related insights concerning Company as contained in this report, and no form of compensation is or will be received by Kalkine, Kalkine Media or Kalkine’s other related entities for the publication of this report.
Markets are trading in a highly volatile zone currently due to certain macro-economic issues and geopolitical tensions prevailing. Therefore, it is prudent to follow a cautious approach while investing.
Note 1: Past performance is neither an Indicator nor a guarantee of future performance.
Note 2: Investment decision should be made depending on an individual’s appetite for upside potential, risks, and any previous holdings. This recommendation is purely based on technical analysis, and fundamental analysis has not been considered in this report.
Note 3: Related Risks: This report may be looked at from high-risk perspective and recommendations are provided are for a short duration. Recommendations provided in this report are solely based on technical parameters, and the fundamental performance of the stocks has not been considered in the decision-making process. Other factors which could impact the stock prices include market risks, regulatory risks, interest rates risks, currency risks, social and political instability risks etc.
The reference date for all price data, currency, technical indicators, support, and resistance levels is April 16 2024. The reference data in this report has been partly sourced from REFINITIV.
Technical Indicators Defined:
Support: A level at which the stock prices tend to find support if they are falling, and a downtrend may take a pause backed by demand or buying interest. Support 1 refers to the nearby support level for the stock and if the price breaches the level, then Support 2 may act as the crucial support level for the stock.
Resistance: A level at which the stock prices tend to find resistance when they are rising, and an uptrend may take a pause due to profit booking or selling interest. Resistance 1 refers to the nearby resistance level for the stock and if the price surpasses the level, then Resistance 2 may act as the crucial resistance level for the stock.
Stop-loss: It is a level to protect further losses in case of unfavourable movement in the stock prices.
The Green colour line reflects the 21-period moving average. SMA helps to identify existing price trends. If the prices are trading above the 21-period, prices are currently in a bullish trend (Vice – Versa).
The Blue colour line reflects the 50-period moving average. SMA helps to identify existing price trends. If the prices are trading above the 50-period, prices are currently in a bullish trend (Vice – Versa).
The Orange/ Yellow colour line represents the Trendline.
The Purple colour line in the chart’s lower segment reflects the Relative Strength Index (14-Period), which indicates price momentum and signals momentum in trend. A reading of 70 or above suggests overbought status, while a reading of 30 or below suggests an oversold status.
Disclaimer
Kalkine New Zealand Limited is a Financial Advice Provider (“FAP”) and is authorised by a Class 1 Financial Advice Provider Licence issued by Financial Markets Authority (“FMA”) to provide financial advice. Kalkine provides only general financial advice through its research reports following a person becoming a member. The reports contain buy/sell/hold and other recommendations in relation to equity financial products. The recommendations and opinions [on this website] / [in this report] do not take into account any of your investment objectives, financial situation or needs. Before you make a decision about whether to acquire a financial product, you should obtain the Product Disclosure Statement from the product issuer. You should consider the appropriateness of advice taking into account your own objectives, financial situation and needs and seek independent financial advice before making any financial decisions. If you act on the advice in the research reports, you may have to pay fees, expenses or other amounts (but not to Kalkine). Further information about the complaints and dispute resolution process, as well as information about Kalkine’s duties are available on Kalkine’s website. Please read our Financial Advice Provider (FAP) disclosure statement and Complaints Handling Guide, which are available on the website.

 Please wait processing your request...