Company Overview: Westgold Resources Limited (ASX: WGX) is a gold mining company with an integrated portfolio of underground and open-pit operations supported by processing facilities across Western Australia’s Murchison and Southern Goldfields regions. Silver Mines Limited (ASX: SVL) is an Australian-based silver exploration company. Its project portfolio spans approximately 2,007 square kilometres (490,000 acres) of exploration titles, covering around 80 kilometres of mineralized strike within the Rylstone Volcanics. This Report covers the Price Action, Technical Indicators Analysis along with the Support Levels, Resistance Levels, and Recommendations on these stocks.
WGX’s Technical Analysis:
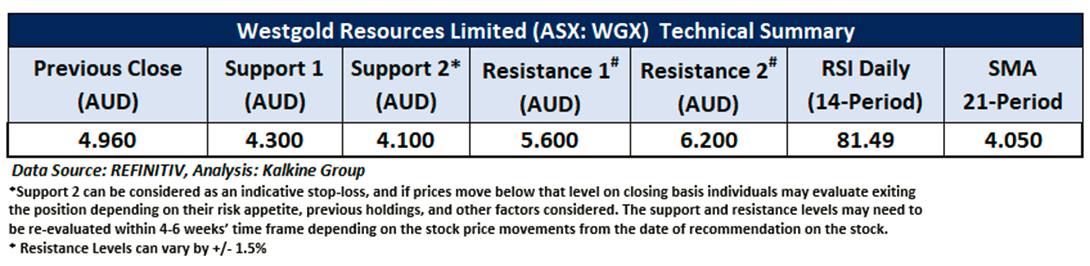
On the daily chart, WGX is holding above a horizontal trendline support, signalling potential for further upside. The 14-period RSI stands at 81.49, highlighting strong buying momentum and slightly overbought conditions. Additionally, the stock is trading well above its 21-period SMA, a key trend indicator that continues to reinforce the prevailing bullish outlook. Crucial support for the stock is positioned at AUD 4.30, while key resistance is placed at AUD 5.60.

Daily Technical Chart – WGX
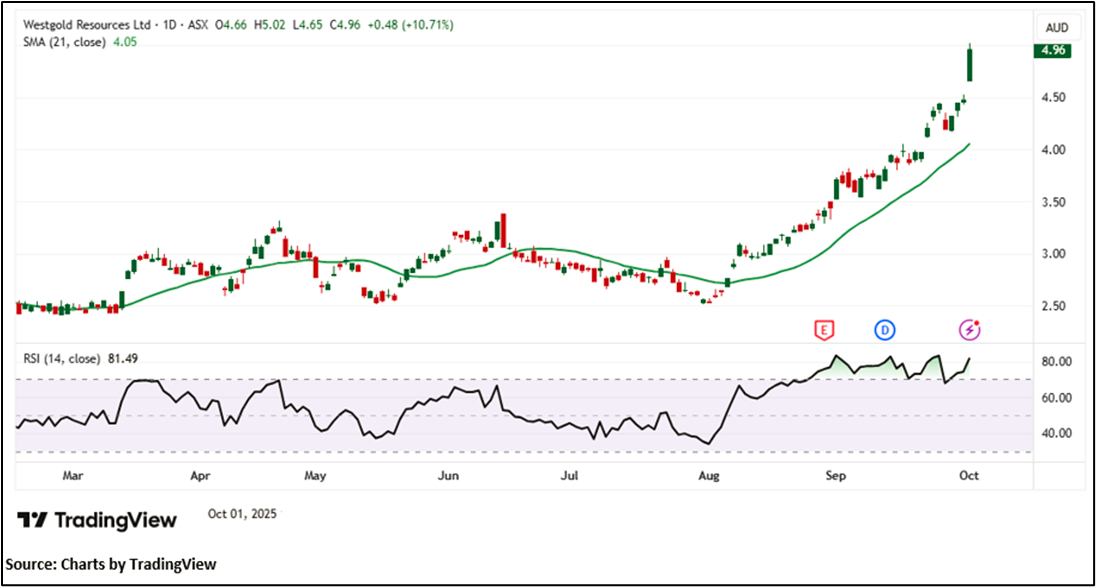
Considering the stock’s current prices are trading above the horizontal trendline support, and momentum oscillator analysis, a “Speculative Buy” recommendation is given on the stock. The stock was analysed as per the closing price of AUD 4.960 per share as on 01 October 2025, up by 10.71%. Westgold Resources Limited (ASX: WGX) was last covered in a report dated ’15 August 2025’.
FY25 Results: The Group reported a net loss of AUD 3.77mn for FY2025, compared to AUD 2.22mn in FY2024. Exploration and development expenditure totaled AUD 9.03mn (FY2024: UAD 10.11mn). In FY2025, the Group recorded revenue of AUD 212,972 (FY2024: AUD 263,129), resulting in a gross profit from continuing operations of AUD 45,722 (FY2024: AUD 57,836).
What to Expect: The year ahead marks a pivotal phase for Silver Mines as the company progress towards development at Bowdens and advance the potential of its US assets. SVL's priorities will center on execution, regulatory approvals, exploration success, and disciplined capital management.
Silver Mines Raises AUD 4.07M Through Oversubscribed SPP
Silver Mines Limited (ASX: SVL) has successfully closed its Share Purchase Plan (SPP), receiving AUD 4.07 million in applications—well above the initial AUD 3 million target. The strong demand highlights the continued support of loyal shareholders and follows the Company’s recently completed AUD 30 million share placement announced on 5 August 2025.
SVL’s Technical Analysis:
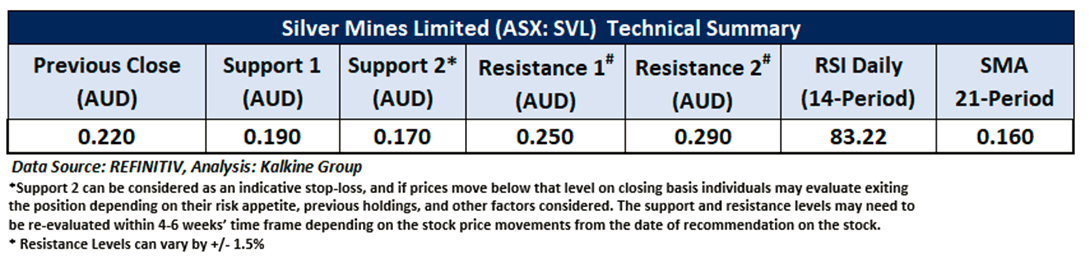
On the daily chart, SVL is holding above a horizontal trendline support, indicating scope for further upside. The 14-period RSI is at 83.22, reflecting strong buying momentum but also highlighting overbought conditions that may warrant caution. The stock remains well above its 21-period SMA, a key trend indicator that continues to reinforce the prevailing bullish outlook. Crucial support for the stock is positioned at AUD 0.190, while key resistance is placed at AUD 0.250.

Daily Technical Chart – SVL
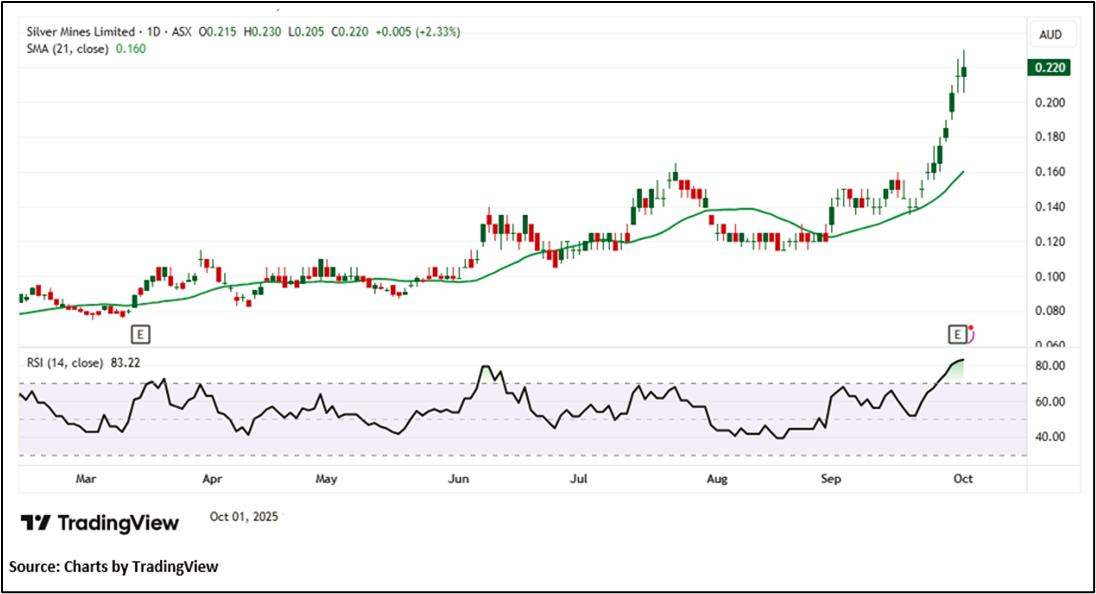
Considering the stock’s current prices are trading above the rising trendline support, and momentum oscillator analysis, a “Speculative Buy” recommendation is given on the stock. The stock was analysed as per the closing price of AUD 0.220 per share as on 01 October 2025, up by 2.33%. Silver Mines Limited (ASX: SVL) was last covered in a report dated ’17 March 2025’.
Note 1: Past performance is neither an Indicator nor a guarantee of future performance.
Note 2: Investment decision should be made depending on an individual’s appetite for upside potential, risks, and any previous holdings. This recommendation is purely based on technical analysis, and fundamental analysis has not been considered in this report.
Note 3: Related Risks: This report may be looked at from high-risk perspective and recommendations are provided are for a short duration. Recommendations provided in this report are solely based on technical parameters, and the fundamental performance of the stocks has not been considered in the decision-making process. Other factors which could impact the stock prices include market risks, regulatory risks, interest rates risks, currency risks, social and political instability risks etc.
The reference date for all price data, currency, technical indicators, support, and resistance levels is October 01, 2025. The reference data in this report has been partly sourced from REFINITIV.
Technical Indicators Defined:
Support: A level at which the stock prices tend to find support if they are falling, and a downtrend may take a pause backed by demand or buying interest. Support 1 refers to the nearby support level for the stock and if the price breaches the level, then Support 2 may act as the crucial support level for the stock.
Resistance: A level at which the stock prices tend to find resistance when they are rising, and an uptrend may take a pause due to profit booking or selling interest. Resistance 1 refers to the nearby resistance level for the stock and if the price surpasses the level, then Resistance 2 may act as the crucial resistance level for the stock.
Stop-loss: It is a level to protect further losses in case of unfavourable movement in the stock prices.
The Green colour line reflects the 21-period moving average. SMA helps to identify existing price trends. If the prices are trading above the 21-period, prices are currently in a bullish trend (Vice – Versa).
The Blue colour line reflects the 50-period moving average. SMA helps to identify existing price trends. If the prices are trading above the 50-period, prices are currently in a bullish trend (Vice – Versa).
The Orange/ Yellow colour line represents the Trendline.
The Purple colour line in the chart’s lower segment reflects the Relative Strength Index (14-Period), which indicates price momentum and signals momentum in trend. A reading of 70 or above suggests overbought status, while a reading of 30 or below suggests an oversold status.

 Please wait processing your request...