Company Overview: Actinogen Medical Limited (ASX: ACW) develops therapies for neurological and neuropsychiatric diseases associated with dysregulated brain cortisol in Australia. Boss Energy Limited (ASX: BOE) explores for and produces uranium deposits, holding the Honeymoon uranium project which covers an area of approximately 2,595 square kilometers located in South Australia. Nickel Industries Limited (ASX: NIC) engages in nickel ore mining, nickel pig iron, cobalt, and nickel matte production activities. This Report covers the Price Action, Technical Indicators Analysis along with the Support Levels, Resistance Levels, and Recommendations on these stocks.
ACW’s Technical Analysis:
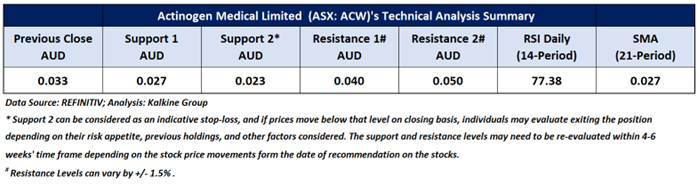
On the daily chart, ACW's stock price broke above a short-term downward trendline, signalling a positive trend. Additionally, the RSI (14-period) is heading northward, providing further support to the mentioned recommendation. Prices are trading above both the 21-period and 50-day SMAs, which may potentially function as dynamic support levels for the stock; in contrast, the stock’s next round levels act as resistance levels. Crucial support for the stock is positioned at AUD 0.027, while key resistance is placed at AUD 0.040.

Daily Technical Chart – ACW
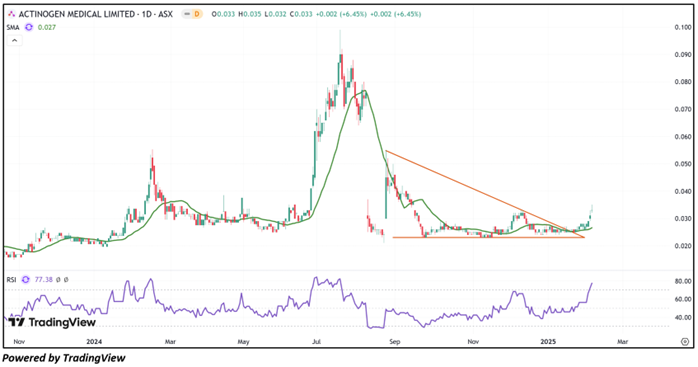
Considering the stock’s current price levels breaking above a downward trendline, and momentum oscillator analysis, a “Speculative Buy” recommendation is given on the stock. The stock was analysed as per the closing price of AUD 0.033 per share as on 06 February 2025, up by 6.45%. Actinogen Medical Limited (ASX: ACW) was last covered in a report dated ’18 March 2021’.
BOE’s Technical Analysis:
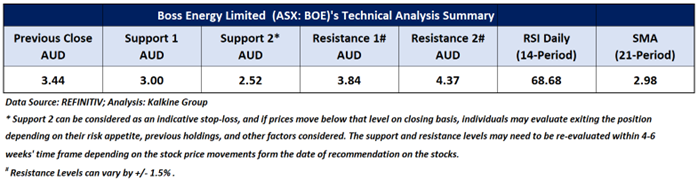
On the daily chart, BOE's stock price broke above a downward trendline, signalling a positive trend. Moreover, the RSI (14-period) is trading above its midpoint, providing further support to the previous analysis. Prices are trading above both the 21-period and 50-day SMAs, which may potentially function as dynamic support levels for the stock; in contrast, the stock’s most recent high might act as a resistance level. Crucial support for the stock is positioned at AUD 3.00, while key resistance is placed at AUD 3.84.

Daily Technical Chart – BOE
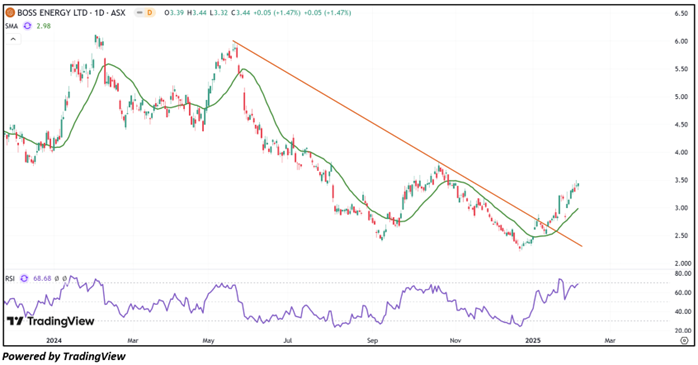
Considering the stock’s current price levels breaking above a downward trendline, and momentum oscillator analysis, a “Speculative Buy” recommendation is given on the stock. The stock was analysed as per the closing price of AUD 3.44 per share as on 06 February 2025, up by 1.47%. Boss Energy Limited (ASX: BOE) was last covered in a report dated ’03 January 2025’.
NIC’s Technical Analysis:
On the daily chart, NIC's stock price is rebounding from the significant support formed by its previous trough, indicating a positive bias. Additionally, the RSI (14-period) is rebounding from its oversold region, adding further support to the previous observation. Prices are trading above both the 21-period and 50-day SMAs, which may potentially function as dynamic support levels for the stock; in contrast, the stock’s most recent high might act as a resistance level. Crucial support for the stock is positioned at AUD 0.735, while key resistance is placed at AUD 0.875.
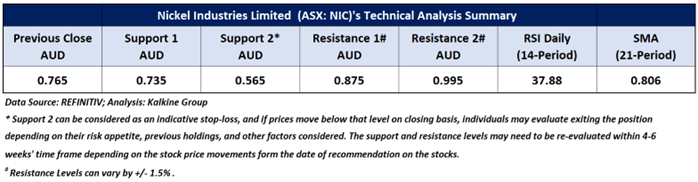

Daily Technical Chart – NIC
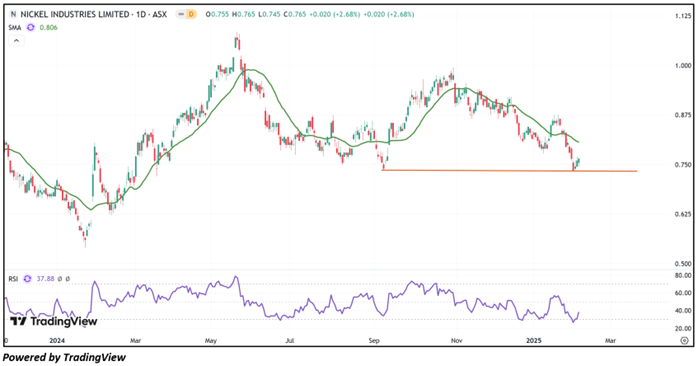
Considering the stock’s current price levels rebounding from the significant support formed by its previous trough, and momentum oscillator analysis, a “Speculative Buy” recommendation is given on the stock. The stock was analysed as per the closing price of AUD 0.765 per share as on 06 February 2025, up by 2.68%. Nickel Industries Limited (ASX: NIC) was last covered in a report dated ’27 January 2024’.
Note 1: Past performance is neither an Indicator nor a guarantee of future performance.
Note 2: Investment decision should be made depending on an individual’s appetite for upside potential, risks, and any previous holdings. This recommendation is purely based on technical analysis, and fundamental analysis has not been considered in this report.
Note 3: Related Risks: This report may be looked at from high-risk perspective and recommendations are provided are for a short duration. Recommendations provided in this report are solely based on technical parameters, and the fundamental performance of the stocks has not been considered in the decision-making process. Other factors which could impact the stock prices include market risks, regulatory risks, interest rates risks, currency risks, social and political instability risks etc.
The reference date for all price data, currency, technical indicators, support, and resistance levels is February 06, 2025. The reference data in this report has been partly sourced from REFINITIV.
Technical Indicators Defined:
Support: A level at which the stock prices tend to find support if they are falling, and a downtrend may take a pause backed by demand or buying interest. Support 1 refers to the nearby support level for the stock and if the price breaches the level, then Support 2 may act as the crucial support level for the stock.
Resistance: A level at which the stock prices tend to find resistance when they are rising, and an uptrend may take a pause due to profit booking or selling interest. Resistance 1 refers to the nearby resistance level for the stock and if the price surpasses the level, then Resistance 2 may act as the crucial resistance level for the stock.
Stop-loss: It is a level to protect further losses in case of unfavourable movement in the stock prices.
The Green colour line reflects the 21-period moving average. SMA helps to identify existing price trends. If the prices are trading above the 21-period, prices are currently in a bullish trend (Vice – Versa).
The Blue colour line reflects the 50-period moving average. SMA helps to identify existing price trends. If the prices are trading above the 50-period, prices are currently in a bullish trend (Vice – Versa).
The Orange/ Yellow colour line represents the Trendline.
The Purple colour line in the chart’s lower segment reflects the Relative Strength Index (14-Period), which indicates price momentum and signals momentum in trend. A reading of 70 or above suggests overbought status, while a reading of 30 or below suggests an oversold status.

 Please wait processing your request...