Company Overview: Kairos Minerals Limited (ASX: KAI) operates as a resource exploration company in Australia. It primarily explores for gold, rare earth element, and lithium properties. Santana Minerals Limited (ASX: SMI) engages in the exploration and evaluation of gold and silver properties in New Zealand, Cambodia, and Mexico. Turaco Gold Limited (ASX: TCG) engages in the acquisition, exploration, and development of gold deposits in Cote d’Ivoire. This Report covers the Price Action, Technical Indicators Analysis along with the Support Levels, Resistance Levels, and Recommendations on these stocks.
Quarterly Update for the Period Ended 31 December 2024:
- The Mt York Gold Project in the Pilbara has shown potential, with a Scoping Study highlighting robust financial returns at a conservative AUD 3,500 gold price. The project plans to implement a 4 Mtpa conventional CIL processing plant with an estimated pre-production capital of AUD 276 million. A fully funded drill program is underway to expand resources, with the mining lease application progressing.
- The company is well-funded with AUD 12.36 million in cash as at 31 December 2024 and expects an additional AUD 10 million from Pilbara Minerals in 2025. These funds will support a significant drill program aimed at expanding and reclassifying gold resources, completing a prefeasibility study, and advancing the mining lease application with the Nyamal Aboriginal Corporation.
KAI’s Technical Analysis:
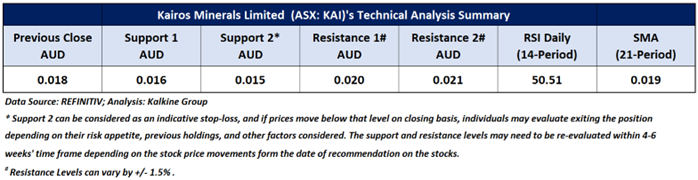
On the daily chart, KAI's stock price is forming higher highs and higher lows, signalling a positive trend. Additionally, the RSI (14-period) is trading above its midpoint, providing further support for the mentioned recommendation. Prices are trading above the 50-day SMA, which may potentially function as dynamic support levels for the stock; in contrast, the stock’s most recent high might act as a resistance level. Crucial support for the stock is positioned at AUD 0.016, while key resistance is placed at AUD 0.020.

Daily Technical Chart – KAI
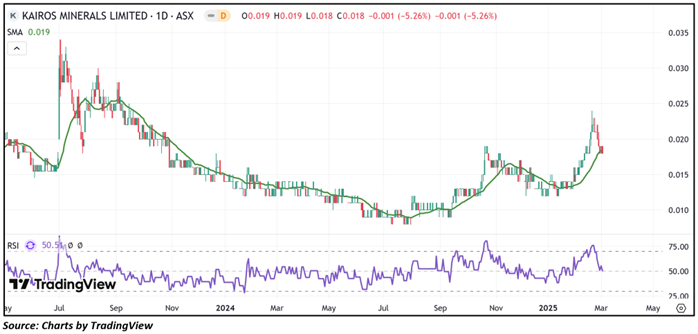
Considering the stock’s current price levels forming higher peaks and higher troughs, and momentum oscillator analysis, a “Speculative Buy” recommendation is given on the stock. The stock was analysed as per the closing price of AUD 0.0180 per share as on 04 March 2025, down by 5.26%. Kairos Minerals Limited (ASX: KAI) was last covered in a report dated ’03 August 2023’.
Recent Update: SMI is pleased to update its Mineral Resource Estimate (MRE), incorporating additional infill drilling since the previous estimate in July 2024. Infill drilling at the Rise & Shine (RAS) deposit, with 28 drill holes totaling 7,060 meters, has refined the resource model, increasing the Indicated Resource grade by 7% (from 2.35g/t to 2.52g/t) and boosting contained gold ounces by 6.4%. This supports the company's Pre-feasibility Study released in November 2024.
Quarterly Update for the Period Ended 31 December 2024:
- The Pre-feasibility Study (PFS) announced on 15 November 2024 outlined ongoing potential for the Bendigo-Ophir Gold Project (BOGP), with an output of 1.15Moz of gold over 9 years at an AISC of AUD 1,416/oz. Since then, the rising gold price has boosted the project’s after-tax NPV8 to AUD 1.2 billion, IRR to 76%, and free cash generation to over AUD 2.0 billion.
- The Company is refining the PFS, focusing on reducing pre-production costs and evaluating open-pit and underground mining options. Water supply agreements are secured, and land acquisitions are in advanced stages. The Bendigo-Ophir project has been fast-tracked, with technical and environmental baseline studies nearly complete.
- The Company ended the quarter with approximately AUD 31 million in cash. During the quarter, 13.4 million options were exercised at AUD 0.36/share, with around 79.9 million in-the-money options, also convertible at AUD 0.36/share, expiring on 28 February 2025.
SMI’s Technical Analysis:
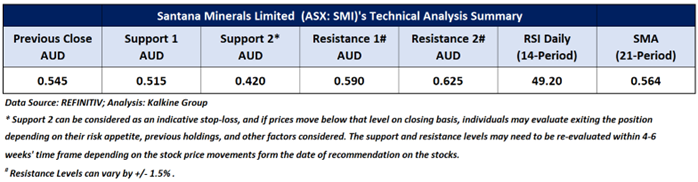
On the daily chart, SMI's stock price is forming higher highs and higher lows, indicating a positive bias. Additionally, which undergoing a minor correction, the stock is approaching a significant support established by previous peak, anticipating a potential rally. Prices are trading above the 50-day SMA, which may potentially function as dynamic support levels for the stock; in contrast, the stock’s most recent high might act as a resistance level. Crucial support for the stock is positioned at AUD 0.515, while key resistance is placed at AUD 0.590.

Daily Technical Chart – SMI
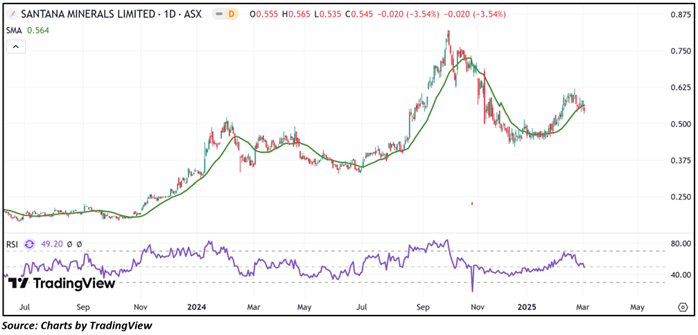
Considering the stock’s current price levels forming higher peaks and higher troughs, and momentum oscillator analysis, a “Speculative Buy” recommendation is given on the stock. The stock was analysed as per the closing price of AUD 0.545 per share as on 04 March 2025, down by 3.54%. Santana Minerals Limited (ASX: SMI) was last covered in a report dated ’13 May 2022’.
Recent Updates:
As per quarterly report released on 31 January 2025, Turaco Gold Limited (ASX: TCG) made progress at its Afema Project in Côte d’Ivoire during Q4 FY24. Following the wet season, drilling resumed, leading to gold discoveries at the Niamienlessa SW and Affienou prospects, with an additional post-quarter discovery at Baffia confirming broad mineralization. Afema stands at 2.52Moz of gold, covering only the Woulo Woulo, Jonction, and Anuiri deposits, with further growth expected as additional mineralized areas undergo drilling and metallurgical testing. Over 15,000m of drilling was completed in the December quarter, and an updated MRE is anticipated by late March or early June quarter.
For H1 FY24, Turaco Gold Limited reported a loss from continuing operations of AU$7.19 million, a significant increase from AU$1.94 million in the prior corresponding period. The higher loss was primarily driven by the completion of the Afema Gold Project acquisition and increased exploration expenditure to advance the project towards its maiden JORC resource estimate.
TCG’s Technical Analysis:
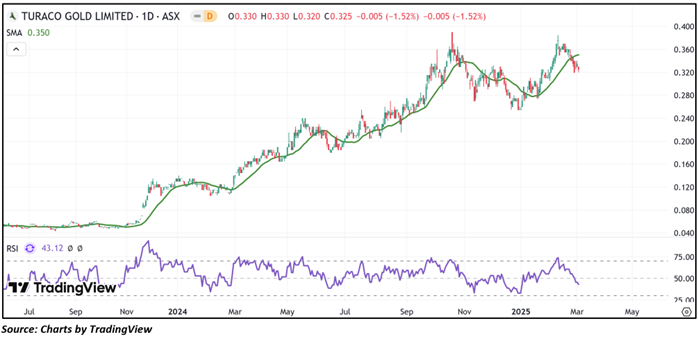
On the daily chart, TCG's stock price is forming a trading range characterized by lower highs and higher lows, suggesting that the sideways period in the stock might continue to persist in the near future. Additionally, the RSI (14-period) is hovering near its midpoint, providing further support for the mentioned recommendation. Prices are trading between its previous peak and trough, which may potentially function as resistance and support levels for the stock, respectively. Crucial support for the stock is positioned at AUD 0.305, while key resistance is placed at AUD 0.350.
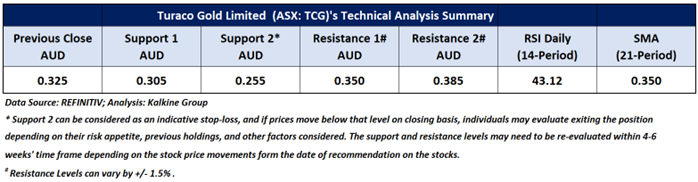
Daily Technical Chart – TCG
Individuals can evaluate the stock based on the support and resistance levels provided in the report in case of keen interest, taking into consideration the risk-reward scenario.
Considering the stock’s current price levels forming higher peaks and higher troughs, and momentum oscillator analysis, a “Watch” recommendation is given on the stock. The stock was analysed as per the closing price of AUD 0.325 per share as on 04 March 2025, down by 1.52%.
Note 1: Past performance is neither an Indicator nor a guarantee of future performance.
Note 2: Investment decision should be made depending on an individual’s appetite for upside potential, risks, and any previous holdings. This recommendation is purely based on technical analysis, and fundamental analysis has not been considered in this report.
Note 3: Related Risks: This report may be looked at from high-risk perspective and recommendations are provided are for a short duration. Recommendations provided in this report are solely based on technical parameters, and the fundamental performance of the stocks has not been considered in the decision-making process. Other factors which could impact the stock prices include market risks, regulatory risks, interest rates risks, currency risks, social and political instability risks etc.
The reference date for all price data, currency, technical indicators, support, and resistance levels is March 04, 2025. The reference data in this report has been partly sourced from REFINITIV.
Technical Indicators Defined:
Support: A level at which the stock prices tend to find support if they are falling, and a downtrend may take a pause backed by demand or buying interest. Support 1 refers to the nearby support level for the stock and if the price breaches the level, then Support 2 may act as the crucial support level for the stock.
Resistance: A level at which the stock prices tend to find resistance when they are rising, and an uptrend may take a pause due to profit booking or selling interest. Resistance 1 refers to the nearby resistance level for the stock and if the price surpasses the level, then Resistance 2 may act as the crucial resistance level for the stock.
Stop-loss: It is a level to protect further losses in case of unfavourable movement in the stock prices.
The Green colour line reflects the 21-period moving average. SMA helps to identify existing price trends. If the prices are trading above the 21-period, prices are currently in a bullish trend (Vice – Versa).
The Blue colour line reflects the 50-period moving average. SMA helps to identify existing price trends. If the prices are trading above the 50-period, prices are currently in a bullish trend (Vice – Versa).
The Orange/ Yellow colour line represents the Trendline.
The Purple colour line in the chart’s lower segment reflects the Relative Strength Index (14-Period), which indicates price momentum and signals momentum in trend. A reading of 70 or above suggests overbought status, while a reading of 30 or below suggests an oversold status.

 Please wait processing your request...