Company Overview: Nanoveu Limited (ASX: NVU) develops and sells nanotechnology applications for consumer devices in the Americas and Asia, providing Nanoshield, an antiviral protector, which is available in various mobile phone screen covers and cases, as well as a commercial film for various surface applications. This Report covers the Price Action, Technical Indicators Analysis along with the Support Levels, Resistance Levels, and Recommendations on this stock.
Strategic Developments: Nanoveu Limited has been taking strategic moves to enhance its position in AI-driven edge semiconductor solutions.
On 15 October 2024, Nanoveu announced its intention to acquire Embedded A.I. Systems Pte. Ltd. (EMASS), a leading System-on-Chip (SoC) semiconductor design company. This acquisition was completed on 10 February 2025, following shareholder approval and due diligence. The acquisition integrates EMASS’s ultra-low-power SoC technology into Nanoveu’s EyeFly3D platform, enhancing real-time, glasses-free 3D conversion capabilities.
On April 3, 2025, Nanoveu announced a strategic collaboration between EMASS and the Center of Nanoelectronics and Devices (CND) to develop application-specific AI chips using TSMC’s advanced 16nm FinFET process. Dr. Yehia Ismail, Director of CND, was appointed as a Strategic Advisor to EMASS, for strengthening technical leadership.
Financial Summary:
For the year ended 31 December 2024, Nanoveu reported revenue of AU$006.873 million, a 93% decrease from the previous year. The net loss after tax was AU$2.998 million (widened 39% YoY), reflecting increased operational expenses and investments in technology development and acquisitions. However, the acquisition of EMASS, completed in February 2025, is expected to contribute to future revenue growth by enhancing Nanoveu’s product offerings and expanding its market reach in the AI and edge computing sectors. Nanoveu received a USD 850,000 purchase order from Rahum Nano Tech for its EyeFly3D technology, reflecting progress in commercializing its products.
Risks and Challenges:
Nanoveu’s small market capitalization and ongoing losses indicate a higher risk profile. Furthermore, the integration of EMASS’s technology into Nanoveu’s platforms requires successful execution and commercialization to yield returns.
NVU’s Technical Analysis:
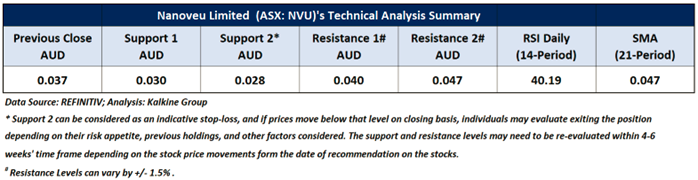
On the daily chart, NVU's stock price is rebounding from the lower boundary of a symmetrical triangle pattern, anticipating a potential rally. Additionally, the RSI (14-period) is rebounding from its oversold region, providing further support for the mentioned recommendation. Prices are trading below both the 21-period and 50-day SMAs, which may potentially function as dynamic resistance levels for the stock; in contrast, the stock’s most recent low might act as a support level. Crucial support for the stock is positioned at AUD 0.030, while key resistance is placed at AUD 0.040.

Daily Technical Chart – NVU
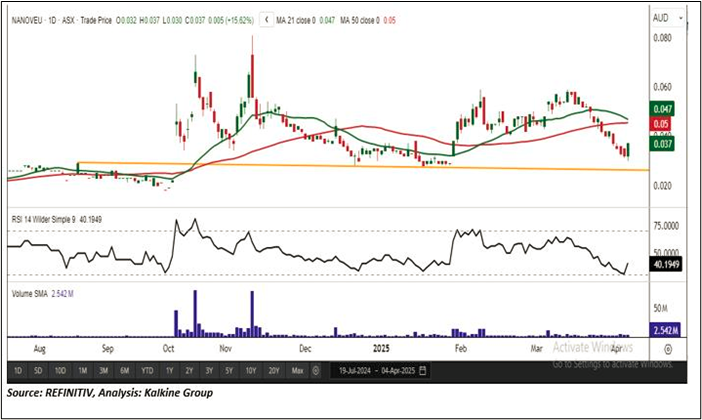
Considering the stock’s current price levels forming higher peaks and higher troughs, and momentum oscillator analysis, a “Speculative Buy” recommendation is given on the stock. The stock was analysed as per the closing price of AUD 0.037 per share as on 04 April 2025, up by 15.62%.
Note 1: Past performance is neither an Indicator nor a guarantee of future performance.
Note 2: Investment decision should be made depending on an individual’s appetite for upside potential, risks, and any previous holdings. This recommendation is purely based on technical analysis, and fundamental analysis has not been considered in this report.
Note 3: Related Risks: This report may be looked at from high-risk perspective and recommendations are provided are for a short duration. Recommendations provided in this report are solely based on technical parameters, and the fundamental performance of the stocks has not been considered in the decision-making process. Other factors which could impact the stock prices include market risks, regulatory risks, interest rates risks, currency risks, social and political instability risks etc.
The reference date for all price data, currency, technical indicators, support, and resistance levels is April 04, 2025. The reference data in this report has been partly sourced from REFINITIV.
Technical Indicators Defined:
Support: A level at which the stock prices tend to find support if they are falling, and a downtrend may take a pause backed by demand or buying interest. Support 1 refers to the nearby support level for the stock and if the price breaches the level, then Support 2 may act as the crucial support level for the stock.
Resistance: A level at which the stock prices tend to find resistance when they are rising, and an uptrend may take a pause due to profit booking or selling interest. Resistance 1 refers to the nearby resistance level for the stock and if the price surpasses the level, then Resistance 2 may act as the crucial resistance level for the stock.
Stop-loss: It is a level to protect further losses in case of unfavourable movement in the stock prices.
The Green colour line reflects the 21-period moving average. SMA helps to identify existing price trends. If the prices are trading above the 21-period, prices are currently in a bullish trend (Vice – Versa).
The Blue colour line reflects the 50-period moving average. SMA helps to identify existing price trends. If the prices are trading above the 50-period, prices are currently in a bullish trend (Vice – Versa).
The Orange/ Yellow colour line represents the Trendline.
The Purple colour line in the chart’s lower segment reflects the Relative Strength Index (14-Period), which indicates price momentum and signals momentum in trend. A reading of 70 or above suggests overbought status, while a reading of 30 or below suggests an oversold status.

 Please wait processing your request...