Company Overview: Gold Hydrogen Limited (ASX: GHY) engages in the discovery, exploration, and development of hydrogen and helium gas with its flagship project - Ramsay - covering an area of approximately 7,820 square kilometres located on the Yorke Peninsula and Kangaroo Island in South Australia. This Report covers the Price Action, Technical Indicators Analysis along with the Support Levels, Resistance Levels, and Recommendations on this stock.
Recent Updates:
Japan Hydrogen Summit Presentation (April 24, 2025): Gold Hydrogen showcased its exploration progress and strategic plans at the Japan Hydrogen Summit, highlighting its pioneering natural hydrogen and helium projects in South Australia. The presentation emphasized the company’s commitment to advancing its 2025 drilling and data acquisition campaign to delineate the Ramsay project’s hydrogen and helium accumulations, aiming to demonstrate commercial production potential.
Response to ASX Price Query (March 31, 2025): Gold Hydrogen responded to an ASX price query by affirming that there were no undisclosed material factors affecting its share price. The company confirmed that its share price movements were consistent with market conditions and ongoing developments in its exploration activities.
These updates complement the fundamental financial position reported earlier in 2025, where Gold Hydrogen received a AU$6.45 million R&D tax refund and holds approximately AU$7 million in cash reserves, positioning it well to execute its 2025 work program focused on natural hydrogen and helium exploration and appraisal drilling.
Risk: The company remains in the exploration and development phase with no reported revenues or profitability yet.
GHY’s Technical Analysis:
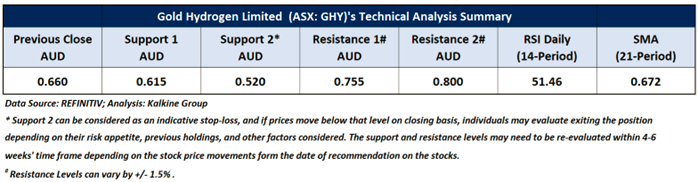
After surpassing a descending wedge pattern in March 2025, GHY's stock price is undergoing an uptrend characterized by higher highs and higher lows, signalling a positive trend. Additionally, the RSI (14-period) is trading above its midpoint, providing further support for the mentioned recommendation. Prices are trading between its previous peak and trough, which may potentially function as resistance and support levels for the stock, respectively. Crucial support for the stock is positioned at AUD 0.615, while key resistance is placed at AUD 0.755.

Daily Technical Chart – GHY
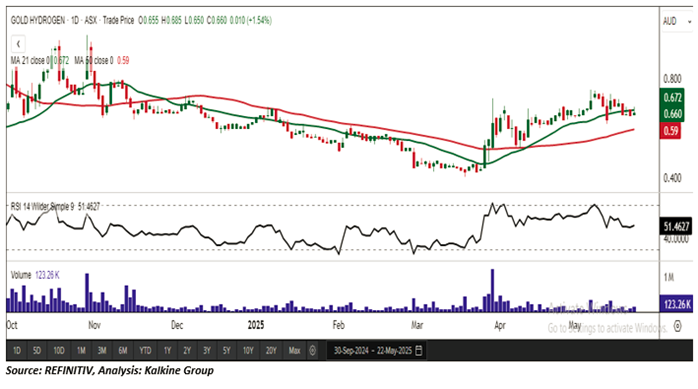
Considering the stock’s current price levels forming higher peaks and higher troughs, and momentum oscillator analysis, a “Speculative Buy” recommendation is given on the stock. The stock was analysed as per the closing price of AUD 0.660 per share as on 22 May 2025, up by 1.54%. Gold Hydrogen Limited (ASX: GHY) was last covered in a report dated ’31 March 2025’.
Note 1: Past performance is neither an Indicator nor a guarantee of future performance.
Note 2: Investment decision should be made depending on an individual’s appetite for upside potential, risks, and any previous holdings. This recommendation is purely based on technical analysis, and fundamental analysis has not been considered in this report.
Note 3: Related Risks: This report may be looked at from high-risk perspective and recommendations are provided are for a short duration. Recommendations provided in this report are solely based on technical parameters, and the fundamental performance of the stocks has not been considered in the decision-making process. Other factors which could impact the stock prices include market risks, regulatory risks, interest rates risks, currency risks, social and political instability risks etc.
The reference date for all price data, currency, technical indicators, support, and resistance levels is May 22, 2025. The reference data in this report has been partly sourced from REFINITIV.
Technical Indicators Defined:
Support: A level at which the stock prices tend to find support if they are falling, and a downtrend may take a pause backed by demand or buying interest. Support 1 refers to the nearby support level for the stock and if the price breaches the level, then Support 2 may act as the crucial support level for the stock.
Resistance: A level at which the stock prices tend to find resistance when they are rising, and an uptrend may take a pause due to profit booking or selling interest. Resistance 1 refers to the nearby resistance level for the stock and if the price surpasses the level, then Resistance 2 may act as the crucial resistance level for the stock.
Stop-loss: It is a level to protect further losses in case of unfavourable movement in the stock prices.
The Green colour line reflects the 21-period moving average. SMA helps to identify existing price trends. If the prices are trading above the 21-period, prices are currently in a bullish trend (Vice – Versa).
The Blue colour line reflects the 50-period moving average. SMA helps to identify existing price trends. If the prices are trading above the 50-period, prices are currently in a bullish trend (Vice – Versa).
The Orange/ Yellow colour line represents the Trendline.
The Purple colour line in the chart’s lower segment reflects the Relative Strength Index (14-Period), which indicates price momentum and signals momentum in trend. A reading of 70 or above suggests overbought status, while a reading of 30 or below suggests an oversold status.

 Please wait processing your request...